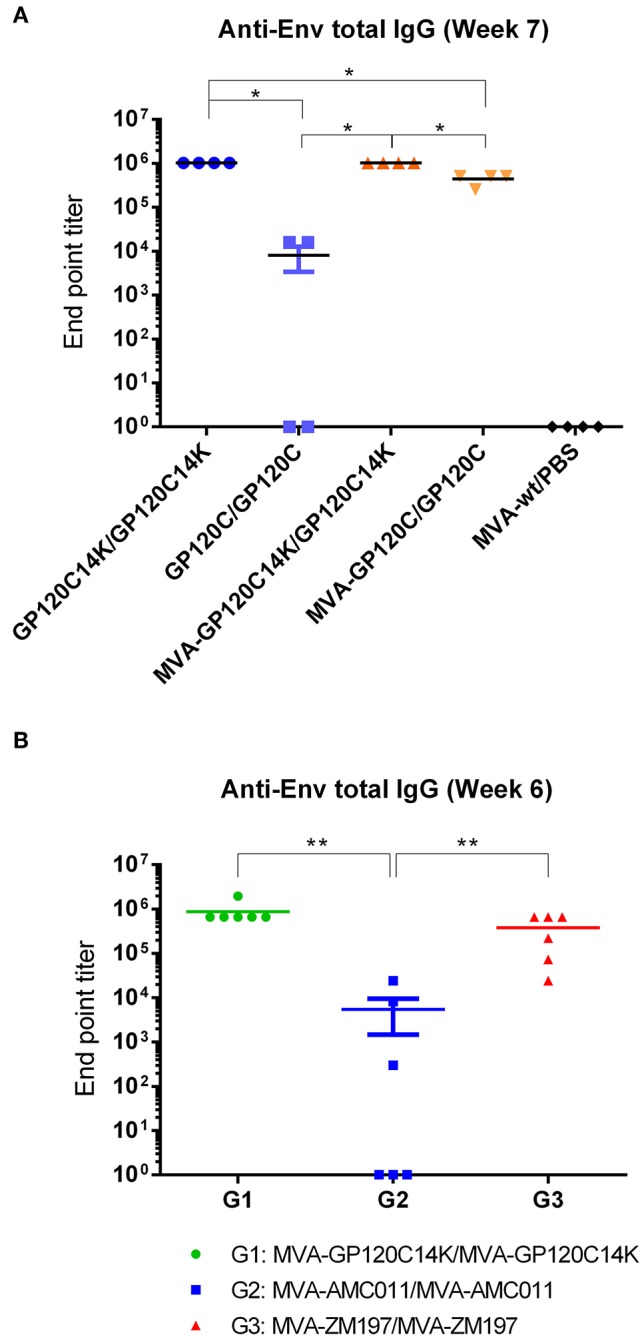
Figure 8.

Anti-Env antibody levels from mice immunized with different prime/boost immunization protocols. (A) Total IgG in the serum of immunized mice at week 7 measured by ELISA. End point titers of antibody responses against GP120C for each group (n = 4) were calculated as the last dilution that provided an optical density value (at 450 nm) that is more than three times the value obtained at the same dilution by the naïve serum. (B) Anti-Env antibody levels (total IgG) in the serum of immunized mice (n = 6) with different MVA vectors at week 6 measured by ELISA, with end point titers referring to antibody reactivity against the corresponding Env protein from each group. The black bar shown in the plot represents the mean with the SEM of the antibody titers from all the animals from each group. For data in (A,B), pairwise Wilcoxon rank sum test with a Benjamini and Hochberg correction was performed to account for multiple comparisons indicated in the figure, **p < 0.01, *p < 0.05.
