Figure 3.

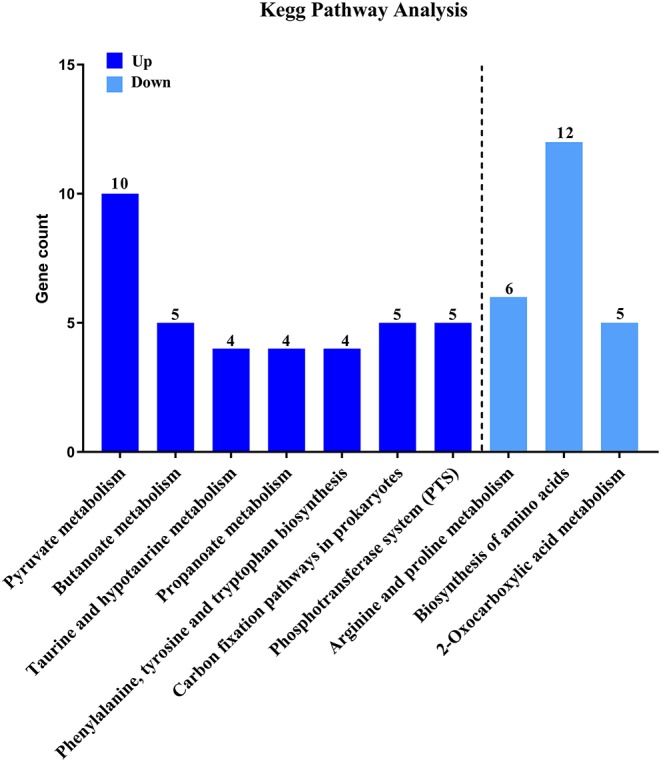
KEGG pathway analysis of DEGs. Here represents CcpA case vs. WT ctrl significantly (P < 0.05) up-regulated genes pathway enrichment and CcpA case vs. WT ctrl significantly (P < 0.05) down-regulated genes pathway enrichment, respectively.

KEGG pathway analysis of DEGs. Here represents CcpA case vs. WT ctrl significantly (P < 0.05) up-regulated genes pathway enrichment and CcpA case vs. WT ctrl significantly (P < 0.05) down-regulated genes pathway enrichment, respectively.