Figure 6.
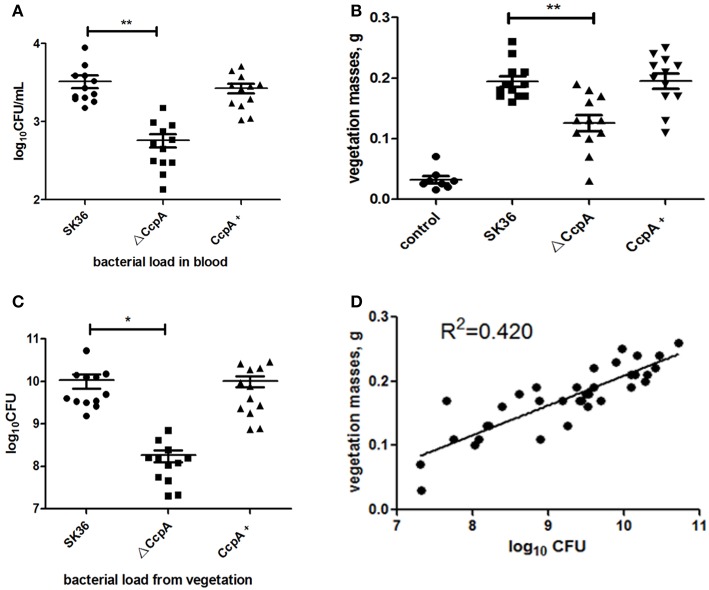
CcpA affects bacterial load and vegetation weight in a S. sanguinis rabbit IE model. (A) Bacterial loads in blood of the rabbit IE model were enumerated as log10 total CFU 24 h after infection. (B) Vegetation masses from the valves of each rabbit IE model were weighed 3 days after infection. (C) Bacterial loads in vegetations of the rabbit IE model were enumerated as log10 total CFU. The data presented are mean value standard error (SE). *,**Indicate the significant difference at P < 0.05 and <0.01, respectively compared to the SK36. (D) Plot represents the correlation between the vegetation bacterial load (total CFU) and vegetation mass. R2 = 0.420 (n = 36) indicated that there was a correlation between them.

