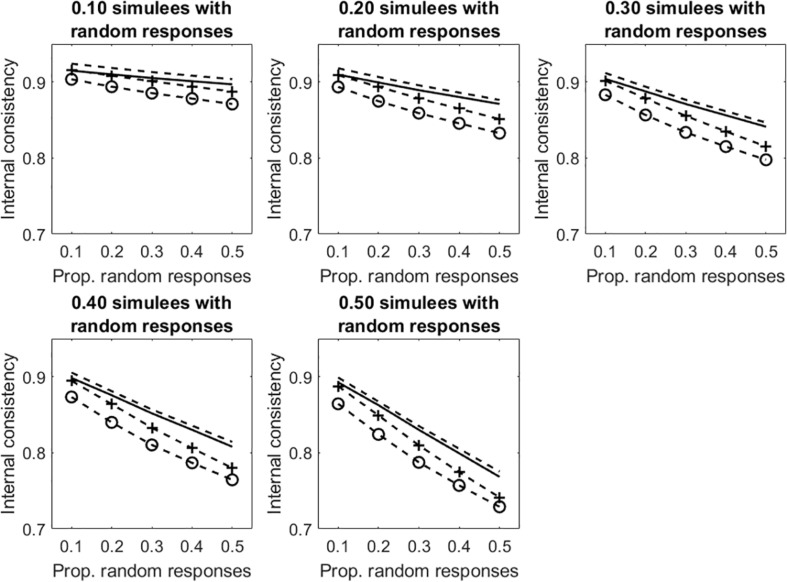
FIGURE 5.
Average internal consistency for the different proportions of simulees with random responses and the different proportions of polytomous items with random responses. The solid line represents α, the unmarked dashed line represents R, the +-marked dashed line represents infit-corrected R, and the o-marked dashed line represents the outfit-corrected R.

