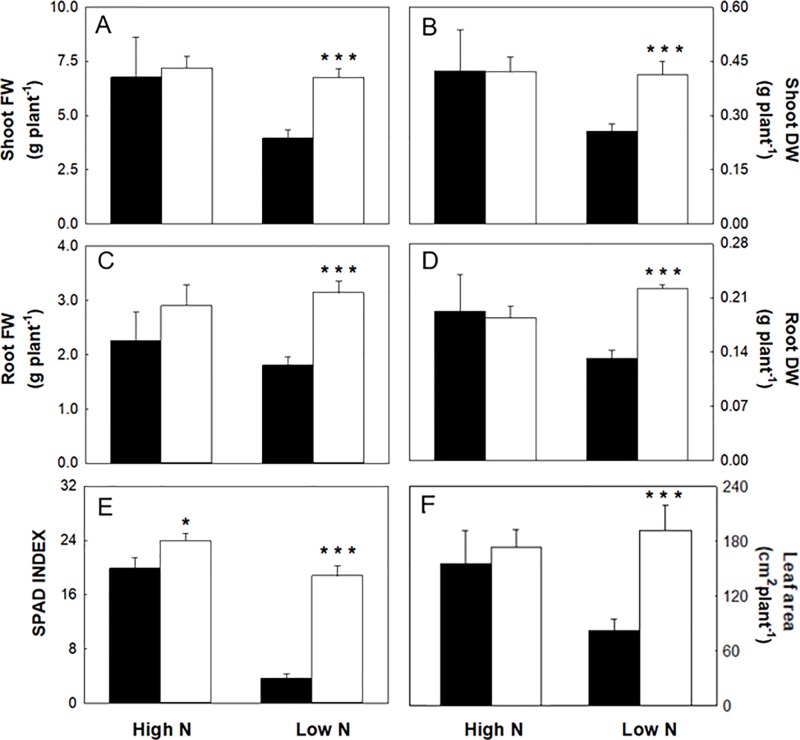
Figure 2.
Biometrics and SPAD index of maize plants hydroponically grown in control (10 mM NO3 -, high N) and stress (1 mM NO3 -, low N) nitrogen conditions with (black bars) and without 1 µM omeprazole (OP) (white bars). (A) FW of shoots, (B) DW of shoots, (C) FW of roots, (D) DW of roots, (E) SPAD index, and (F) leaf area. Data are means ± s.d.; n = 6 and 20 plants for each treatment for biometric and SPAD measurements, respectively. Asterisks denote significant differences (*, P < 0.05; ***, P < 0.001) between untreated controls and OP treated plants.

