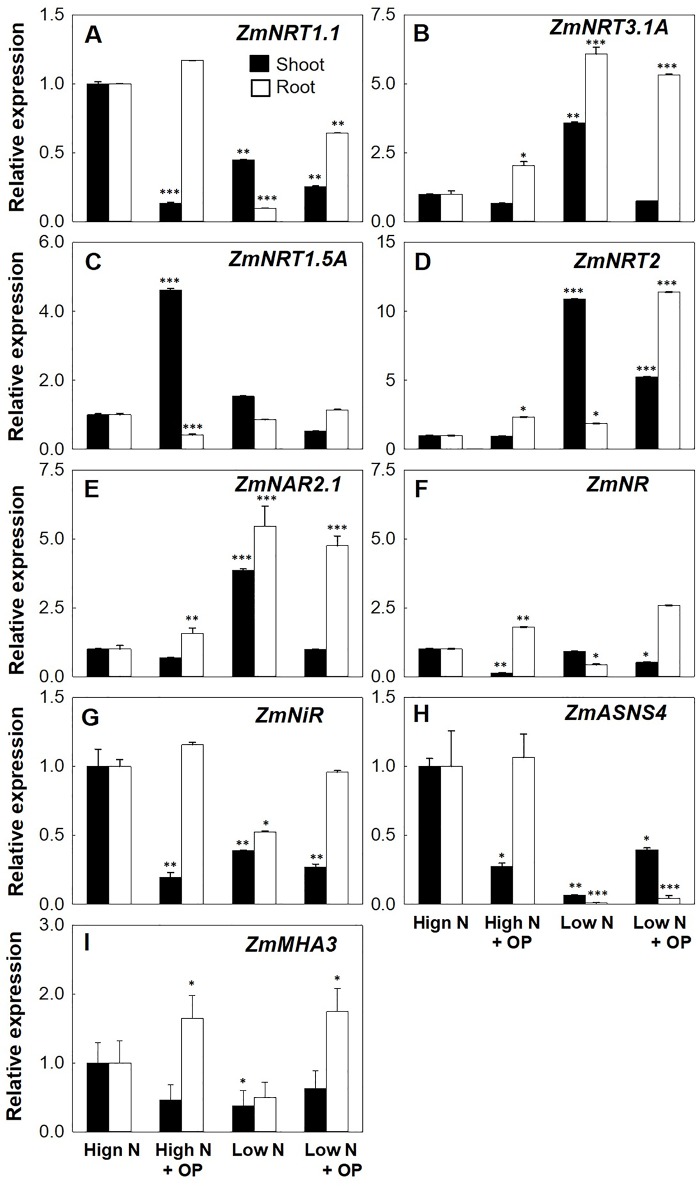
Figure 6.
Nitrogen uptake and assimilation genes expression of maize plants hydroponically grown in in control (10 mM NO3 -, high N) and stress (1 mM NO3 -, low N) nitrogen conditions with and without 1 µM omeprazole (OP) in shoot (black bars) and root (white bars). Relative gene expression (in terms of fold change) of (A) nitrate transporter 1.1 ZmNRT1.1, (B) nitrate transporter 1.3A ZmNRT1.3A, (C) nitrate transporter 1.5A ZmNRT1.5A, (D) nitrate transporters 2.1 and 2.2 ZmNRT2, (E) NAR2-like partner protein ZmNAR2.1, (F) nitrate reductase ZmNR, (G) nitrite reductase ZmNiR, (H) asparagine synthetase ZmASN4, and (I) the plasma membrane MHA3 ATPase ZmMHA3. Data are means of relative expression measurements based on the ∆∆Ct Method ± s.d.; n = 3 biological replicates for each treatment. Asterisks denote significant differences (*, P < 0.05; **, P < 0.01; ***, P < 0.001) between different each treatment and controls under high N according to Student’s T-Test.

