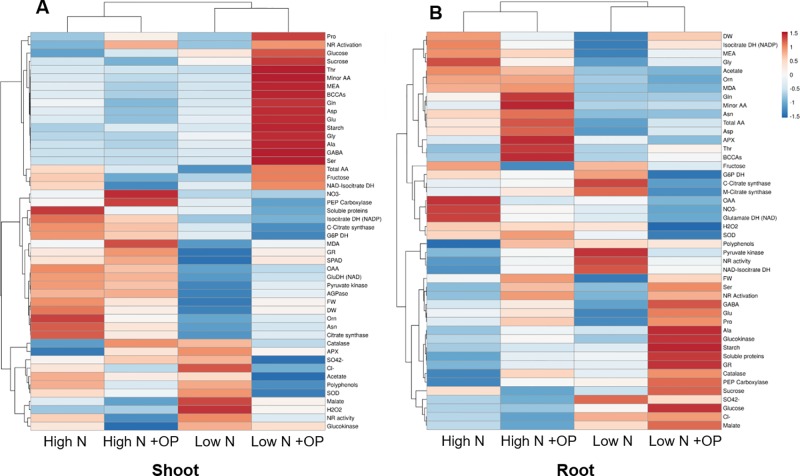
Figure 8.
Cluster heat map analysis summarizing the maize shoot (A) and root (B) responses to high and low nitrogen concentration in the nutrient solution and omeprazole (OP) treatment. Plants were hydroponically grown in control (10 mM NO3 -, high N) and stress (1 mM NO3 -, low N) nitrogen conditions with and without 1 µM OP. The heat map was generated using the https://biit.cs.ut.ee/clustvis/online program package with Euclidean distance as the similarity measure and hierarchical clustering with complete linkage. Data presented are means of biological replicates; biometric measurements (FW of shoots, DW of shoots, FW of roots, DW of roots, leaf area) (n = 6), SPAD index (n = 20), and other biochemical measurements (n = 3).

