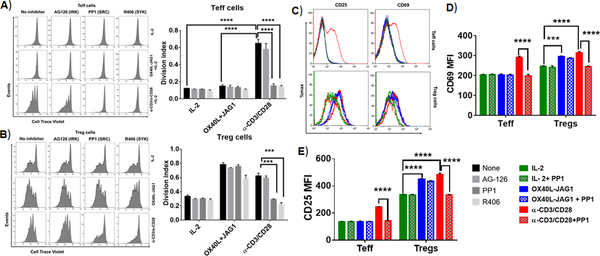
Figure-1:
A-B) CD4+CD25- Tconv cells (A) and CD4+CD25+ Treg (B) cells were pre-treated with indicated kinase inhibitors (10μM/ml) for 2h and co-treated with IL-2 (25U/ml) and OX40L (5 μg/ml) + JAG1 (1 μg/ml) and αCD3+ αCD28 monoclonal antibodies in the presence of IL-2 for 4 days. Cell proliferation was measured by cell trace violet dilution assay. Bar graphs show division index calculated from cell trace violet dilution in each culture conditions (Values represent Mean ± SEM, n=3, ****p<0.001, ***p<0.05). C) Overlay histograms show CD69 and CD25 expression in gated CD4+Foxp3- Teff cells (top panel) and CD4+Foxp3+ Tregs (bottom panel) from the above experiments. Bar graphs show MFI values of CD69 (D) and CD25 expression (E) in Teff and Treg cells summarized from C. Values are expressed as Mean ± SEM (n=3 independent experiments; ***p<0.005, ****p<0.001).

