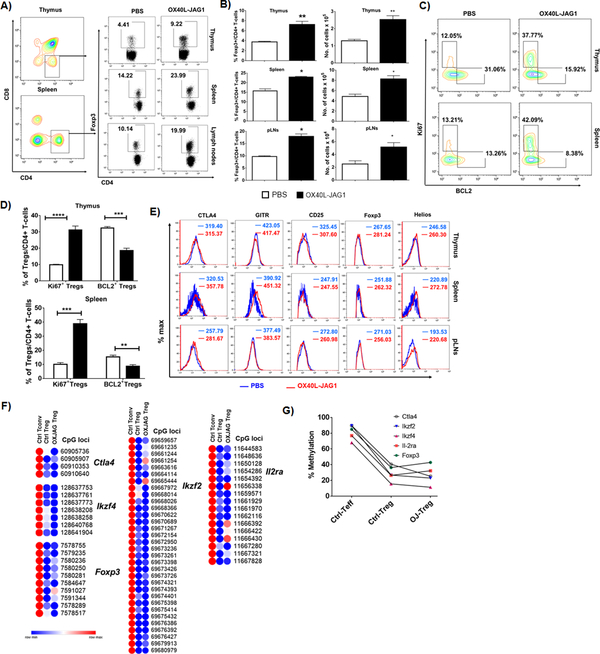
Figure-3:
A) 6–8week-old female NOD mice were injected with PBS or soluble OX40L and JAG1 (100μg each) once a week for 3 consecutive weeks and percentages of CD4+Foxp3+ Tregs were analyzed in the thymus, spleen and peripheral lymph nodes. B) Bar graph show frequency of and number of Tregs (Values represent Mean ± SEM, n=6, *p<0.05, **p<0.01). C) CD4+Foxp3+ from the thymus and spleen were gated and contour plots show Ki67+BCL2- (proliferating) and Ki67-BCL2+ (resting) cells. D) Bar graphs summarize frequencies of Ki67+BCL2- (proliferating) and Ki67-BCL2+ (resting) Tregs in the thymus and spleen calculated from Fig-3C. (Values represent Mean ± SEM, n=6, **p<0.01, ***p<0.005, ****p<0.001). E) Overlay histograms show the expression levels of Treg signature markers CTLA4, GITR, CD25, Foxp3 and Helios expression in CD4+Foxp3+ cells in the thymus, spleen and pancreatic lymph nodes of PBS (Blue) Vs OX40L (Red) treated mice. F) Heat maps show methylation index of individual CpG islands between control and OX40l-JAG1 treated Tregs compared to control Teff cells. G) Percentage methylation levels in the promoter and intronic regions of Treg signature genes Ctla4, Ikzf4, Ikzf2, Il-2ra and Foxp3 in sorted splenic CD4+CD25+ Tregs and CD4+CD25- Teff cells from PBS and OX40L-JAG1 treated NOD mice as analyzed by WGBS.

