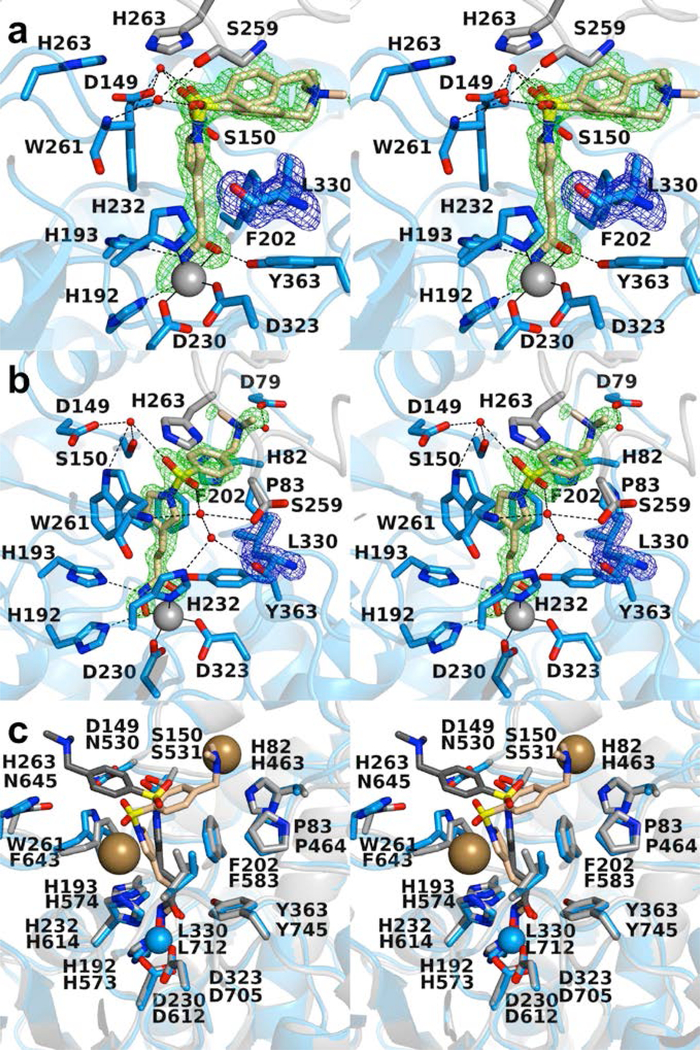
Figure 7.

(a) Polder omit map of the K330L HDAC6 CD1–Resminostat complex (PDB 6UOB; monomer A, contoured at 3.5 σ). L330 is contoured at 3.5 σ. Atoms are color-coded as follows: C = light blue (monomer A), light gray (monomer B), or wheat (inhibitor), N = blue, O = red, S = yellow, Zn2+ =gray sphere, and water molecules = smaller red spheres. Metal coordination and hydrogen bond interactions are indicated by solid and dashed black lines, respectively. (b) Polder omit map of the K330L HDAC6 CD1–Resminostat complex (PDB 6UOB; monomer B, contoured at 5.0 σ). L330 is contoured at 3.5 σ. Atoms are color-coded as follows: C = light blue (monomer B), light gray (symmetry mate), or wheat (inhibitor), N = blue, O = red, S = yellow, Zn2+ =gray sphere, and water molecules = smaller red spheres. Metal coordination and hydrogen bond interactions are indicated by solid and dashed black lines, respectively. (c) Superposition of the K330L HDAC6 CD1–Resminostat complex (monomer B, color-coded as in (a)) and the wild-type HDAC6 CD2–Resminostat complex (monomer B, C = light gray (protein) or dark gray (inhibitor), I– = large sand-colored spheres; PDB 6PZR). The inhibitor capping group binds in alternate locations in each active site. The inhibitor binding conformation in the HDAC6 CD2 active site appears to be influenced by the binding of two iodide ions.
