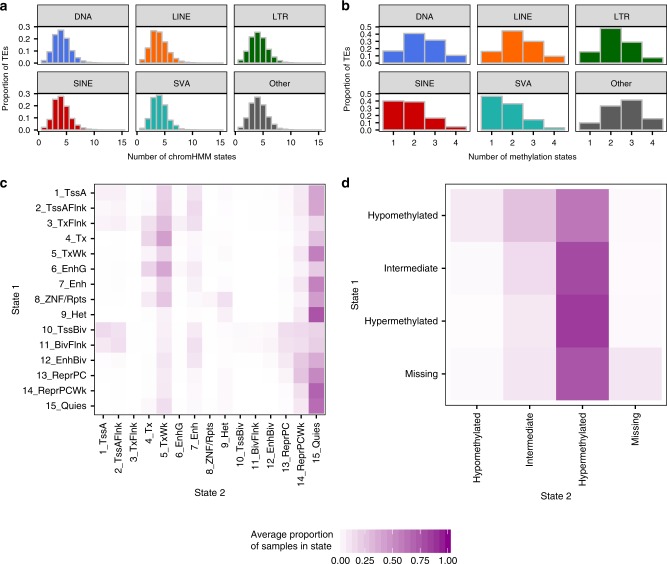
Fig. 3. Epigenetic state dynamics of TEs.
a For all individual TEs in each class, the total number of chromHMM states the TE is annotated with across all epigenomes (DNA n = 456,948 TEs, LINE n = 1,480,369, LTR n = 708,210, SINE n = 1,769,839, SVA n = 3,608, Other n = 11,814). b For all individual TEs in each class, the total number of methylation states the TE is annotated with across all epigenomes (TEs overlapping CpGs only: DNA n = 275,140 TEs, LINE n = 952,459, LTR n = 532,571, SINE n = 1,430,171, SVA n = 3,519, Other n = 6,568). a, b Histograms are colored by class (facet). c For TEs in chromHMM State 1 in at least one Roadmap epigenome (see Fig. 2a, red dots), the average proportion of epigenomes in which they are annotated with chromHMM State 2 (represented by color scale below c, d, 0 to 100% of epigenomes). d For TEs in methylation State 1 in at least one Roadmap epigenome (see Fig. 2a, red dots), the average proportion of epigenomes in which they are annotated with methylation State 2 (represented by color scale below c, d, 0 to 100% of epigenomes).

