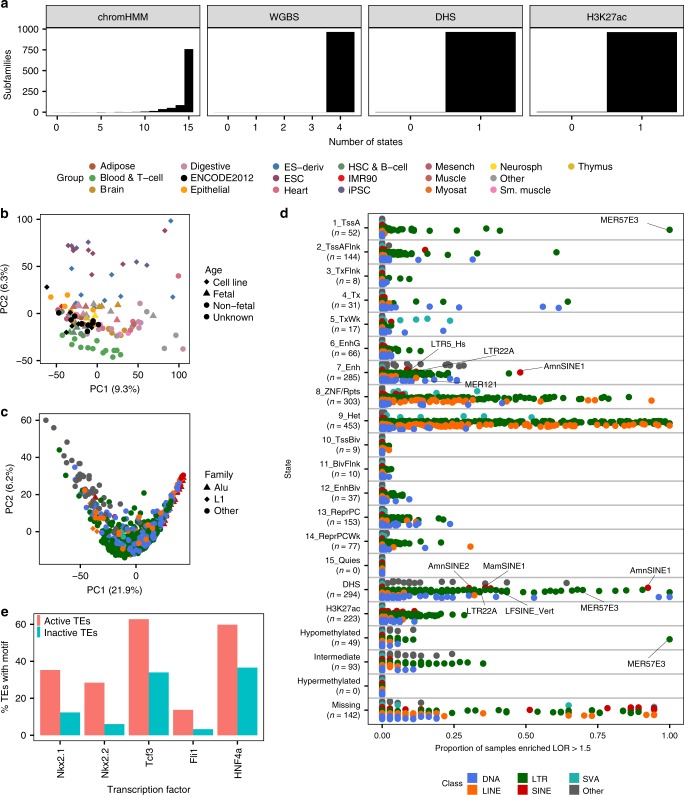
Fig. 5. Tissue-specific enrichment of TE subfamilies in epigenetic states.
a The total number of epigenetic states with which each TE subfamily is annotated across all epigenomes (see Methods; n = 968 TE subfamilies, n = 965 for methylation states). b PCA on Roadmap epigenomes (n = 127 epigenomes), using the LOR enrichment of each TE subfamily in each chromHMM state (13,716 subfamily-by-state combinations) as variables. Color is based on group (see legend above Fig. 5b), and shape is based on epigenome age (non-fetal and unknown age are not distinguished). c PCA on TE subfamilies (n = 937 subfamilies), using the LOR enrichment of the subfamily in each chromHMM state in each Roadmap epigenome (1,904 state-by-epigenome combinations) as variables. Color is based on class (see legend below Fig. 5d), and shape is based on TE family (only Alu and L1 are highlighted). b, c The amount of variation explained by each PC is listed in parentheses. d The proportion of epigenomes each TE subfamily is enriched LOR > 1.5 in the epigenetic state (chromHMM states 127 epigenomes, methylation states 37, DHS 53, H3K27ac 98). Each subfamily is represented by a circle and is colored by TE class (see Methods). The n below each state on the y-axis indicates the number of subfamilies enriched in the state in at least one epigenome. e The percentage of LTR22A elements that contain a binding motif for the transcription factor. Active TEs: elements annotated with the 7_Enh enhancer state in epigenomes where the subfamily is enriched in the state (n = 103 TEs); Inactive TEs: elements never in the state (n = 68 TEs). The top 5 most significant transcription factors as predicted by HOMER are shown (binomial FDR-corrected P-value < 0.0001 for each).

