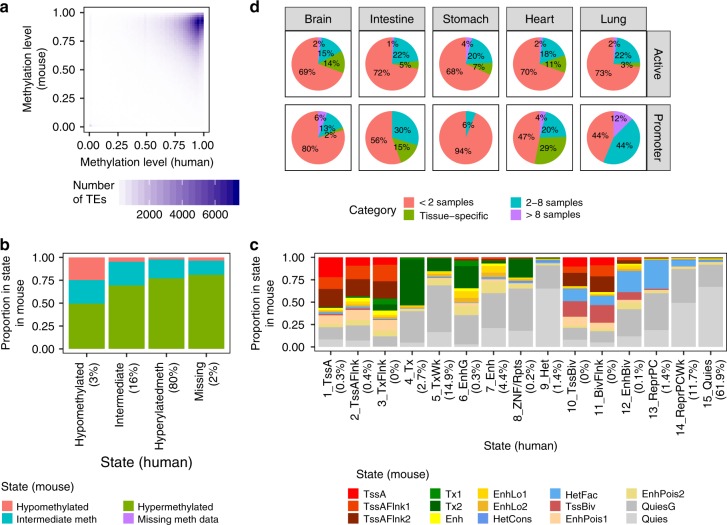
Fig. 7. Conserved epigenetic profiles of orthologous TEs in human and mouse.
a 2D density plot of the methylation level of orthologous TEs (n = 140,185 TEs) in seven anatomy-matched human-mouse epigenome pairs. TE pairs missing methylation in either epigenome or lacking CpGs are excluded. b Methylation state of orthologous TEs in human and mouse across the seven epigenome pairs. Percentages to the right of each x-axis state indicate the proportion of TE ortholog instances across the epigenome pairs that are annotated with that state. c chromHMM state of orthologous TEs (n = 296,457 TEs) in human and mouse across twelve anatomy-matched epigenome pairs. Percentages to the right of each x-axis state indicate the proportion of TE ortholog instances across the epigenome pairs that are annotated with that state. d Tissue-specificity profiles in mouse for orthologous TEs that exhibit tissue specificity in that tissue in human. TEs are considered tissue-specific if they are annotated with a state in two epigenomes from the same tissue but fewer than 5 epigenomes overall. Active: any active regulatory state (Brain n = 1,812 TEs, Intestine n = 1,691, Stomach n = 205, Heart n = 3,081, Lung n = 653); Promoter: 1_TssA/TssA (Brain n = 54 TEs, Intestine n = 27, Stomach n = 16, Heart n = 49, Lung n = 16). TEs in the 2–8 epigenomes category are not specific to the tissue.

