Fig. 7.
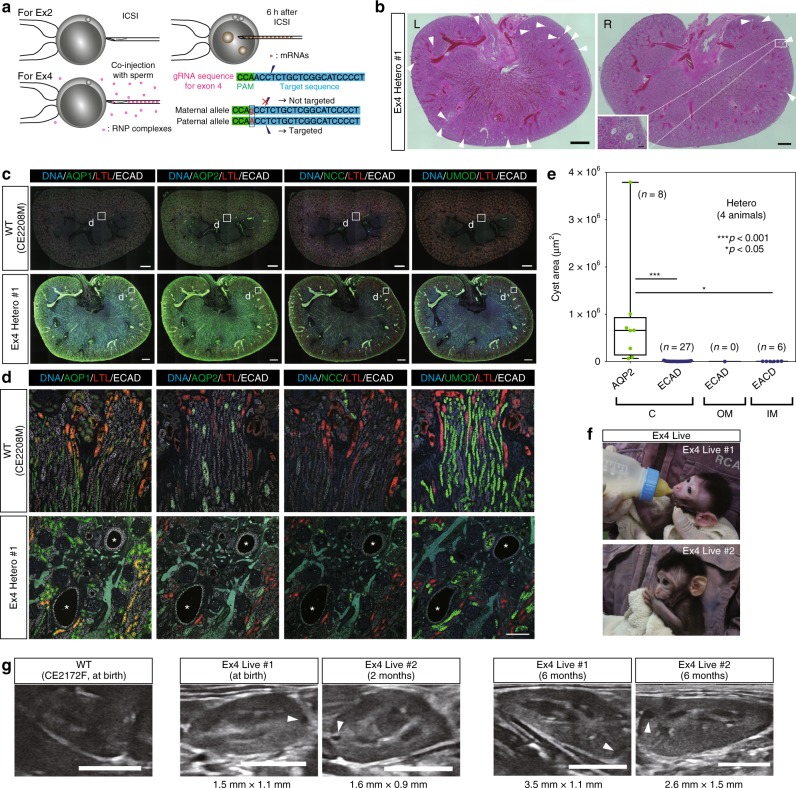
Generation of heterozygotes by allele-specific targeting. a Schematic diagram showing the difference between exon 2 targeting and exon 4 targeting. In exon 2 targeting, mRNAs were injected into zygotes 6 h after ICSI. In exon 4 targeting, gRNA/HiFi Cas9 protein RNPs were co-injected with sperm into MII oocytes. Polymorphism prevents excision of the gRNA target sequence in the maternal allele. b Low-power, H&E-stained image of exon 4 heterozygous kidneys. “L” indicates a left kidney and “R” indicates a right kidney. Arrowheads indicate cyst formation. Scale bars in large images, 1 mm. Scale bar in the small box, 100 µm. c Expressions of nephron segment markers in an exon 4 heterozygous kidney. Small boxes indicate the regions shown at high magnification in d. Scale bar, 1 mm. d Representative ECAD-positive and AQP1-, AQP2-, NCC-, and UMOD-negative cysts in exon 4 heterozygous kidneys. Asterisks indicate cysts. Scale bar, 100 µm. e Box plot of the areas of ECAD-positive or AQP2-positive cysts in all heterozygous kidneys. The top and bottom edges of boxes indicate the first and third quartiles, respectively; the center lines indicate the medians; and the ends of whiskers indicate the maximum and minimum values, respectively. n = 41 cysts in four animals. f Two live monkeys with exon 4 heterozygous mutations. g Cyst formation detected by ultrasonography in exon 4 heterozygotes. Arrowheads indicate cyst formation. Scale bar, 10 mm. Source data are provided as a Source Data file.

