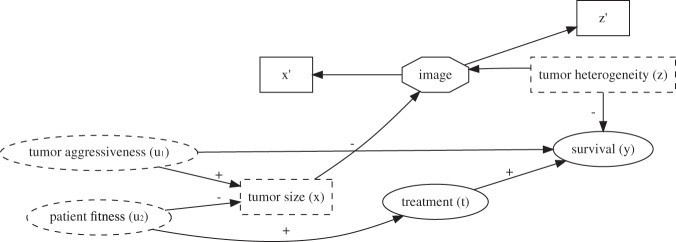
Fig. 1.
Directed Acyclic Graph describing the data-generating mechanism for the simulations. Signs indicate positive or negative associations. Rectangle shaped variables are image variables, dashed variables are unobserved. Tumor aggressiveness and patient fitness cannot be directly measured. represent biological processes, causing the outcome and image patterns. We cannot directly observe these biological processes, but are noisy views of these variables that are measurable from the image. is a collider since it is the child of and . Conditioning on will induce an artificial association between and , thereby inducing a confounding path between treatment and survival, that only exists when conditioning on the collider.

