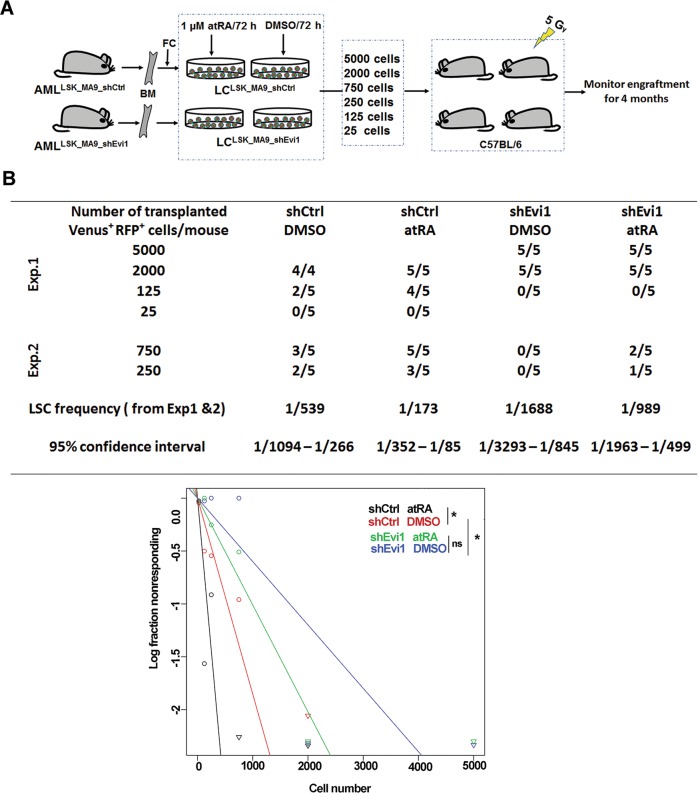
Fig. 3. Evi1 and atRA cooperate to augment LSC activity in an in vivo limiting dilution assay.
a Schematic of experimental design. BM, bone marrow; FC, flow cytometry. b In vivo limiting dilution assay to determine the frequency of functional LSCs. Upper: table showing the numbers of responders (defined by the presence of ≥1% Venus+ RFP+ cells in BM at the time of sacrifice) and the total numbers of evaluable recipients for each cell dose. Data from two independent experiments were combined, and LSC frequencies were calculated by applying the maximum likelihood method using ELDA software. Lower: Plot showing the logarithmized fractions of non-responding recipients of different numbers of LCs. Statistical significance was assessed using the Chi-square test.

