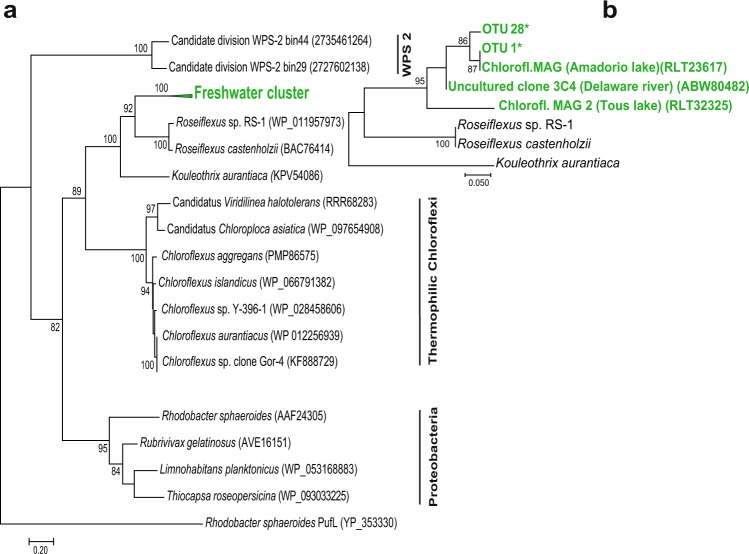
Figure 5.
PufM protein Maximum Likelihood phylogenetic tree, computed using the LG substitution model. A discrete Gamma distribution was used to model evolutionary rate differences with invariant sites. The analysis involved 20 amino acid sequences and a total of 297 positions (a), respectively 25 amino acid sequences and a total of 48 positions (b) in the final dataset. Bootstrap values > 70 are shown. Rhodobacter sphaeroides PufL sequence was used as an outgroup.

