
Figure 2.
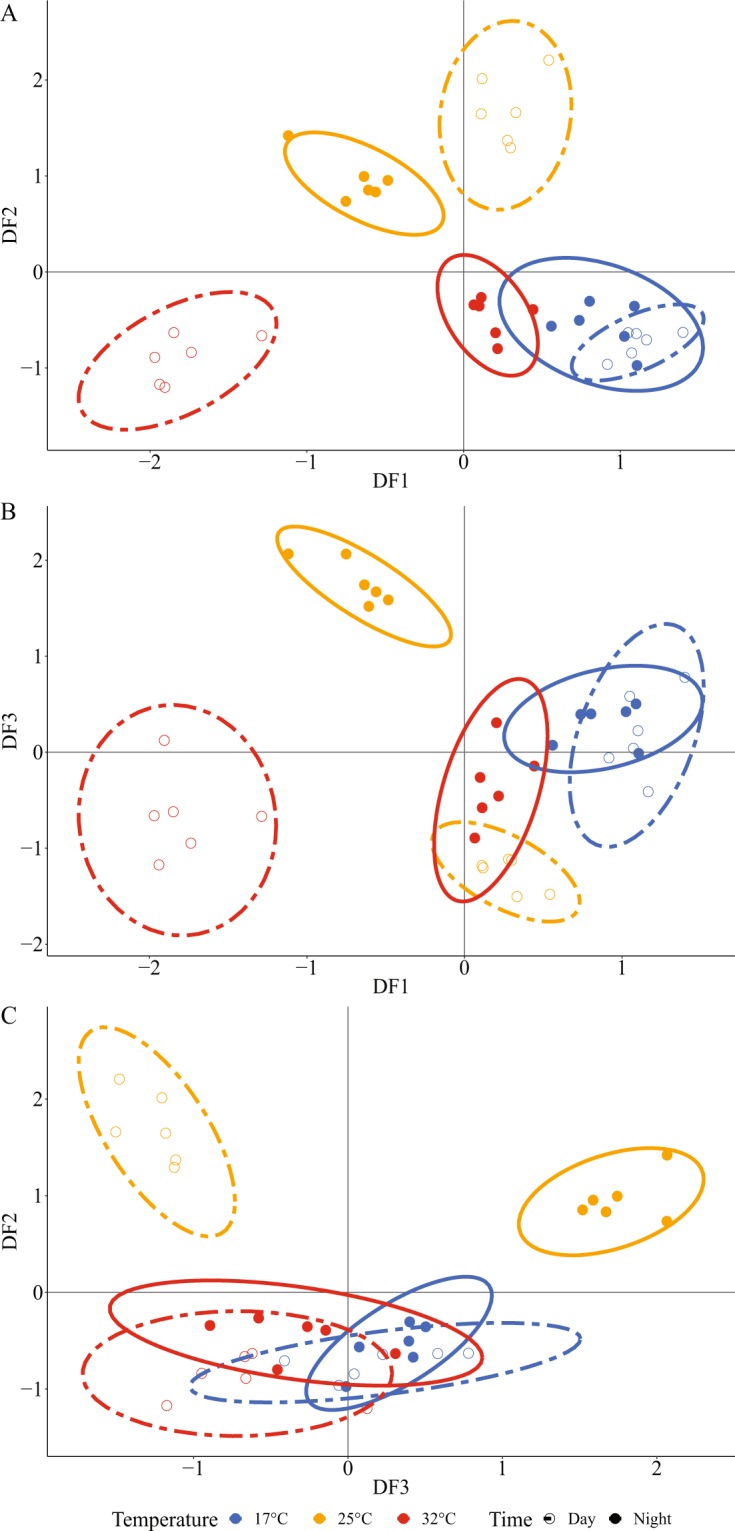
Discriminant analysis on the gene expression of 17 ion transport genes in S. pistillata. Each dot represents the gene expression profiles for each sample, and ellipses show the clusters. Blue denotes samples at 17 °C, yellow at 25 °C, and red at 32 °C. Closed dots (●) represent night individuals and open dots (○) represent day individuals. A, B and C show plots of Discriminant Factors (DF). DF1 explains 24% of variation, DF2 explains 24% and DF3 explains 22%. One-way ANOVAs carried out on each of the three axis of the discriminant analysis showed statistical differences between clusters (P < 0.05).