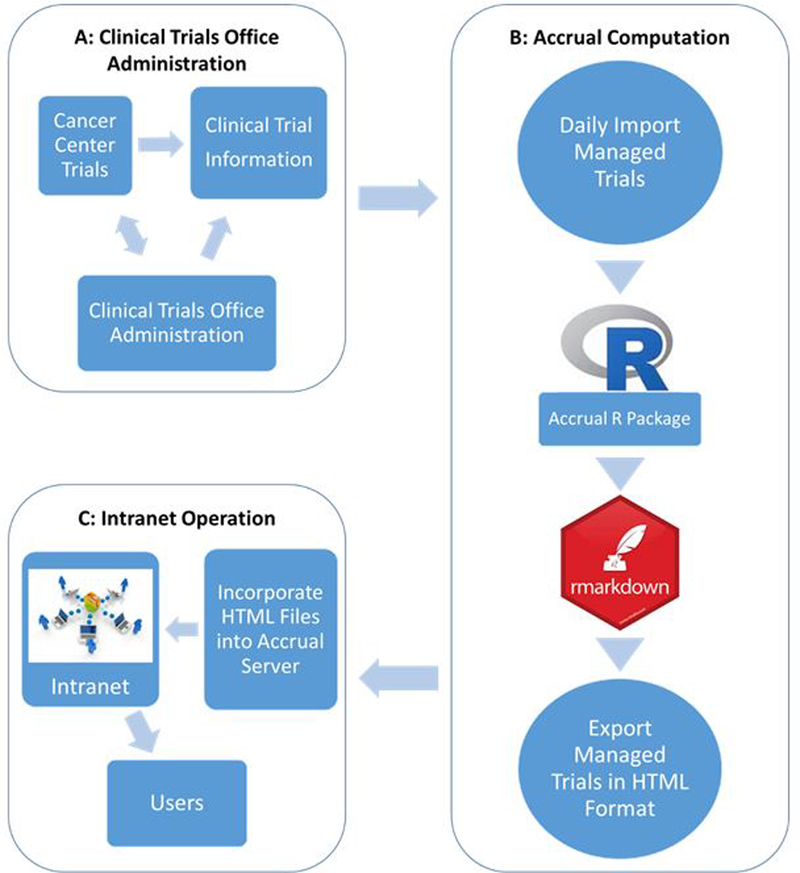
Figure 1.

The flowchart of the Accrual Prediction Program. Figure 1A shows the Clinical Trials Office administration of each clinical trial. Figure 1B displays the process of accrual computation using R software, which starts with importing daily Clinical Trials Office data and ends with an export of the accrual report in Hypertext Markup Language (HTML) format. Figure 1C presents the Intranet operation by incorporating all the HTML files into accrual server.
