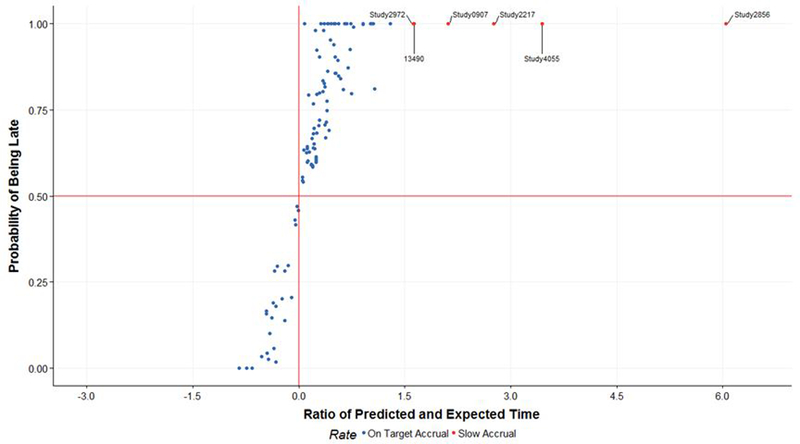
Figure 4.

Volcano plot for the ratio of predicted and expected date versus the probability of being late for each trial. The volcano plot shows a scatterplot with X-axis is the ratios between the predicted completion dates and the expected completion dates with , and the Y-axis is the probabilities of being late (y-axis) for each clinical trial.
