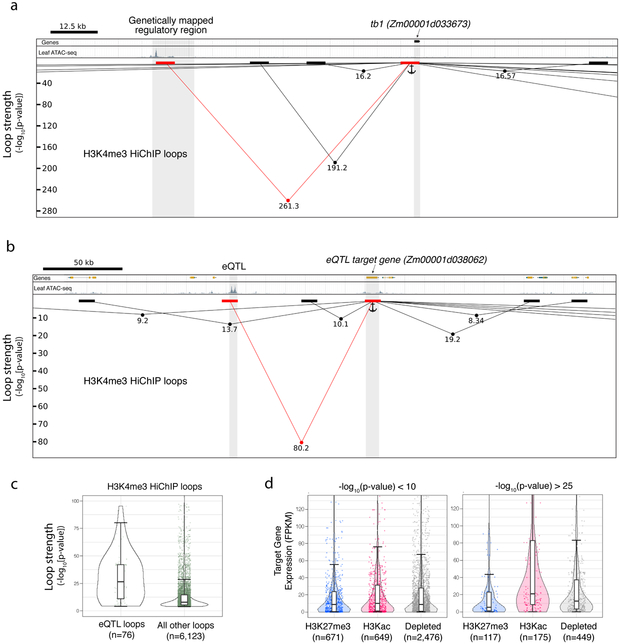
Fig. 4 ∣. Loop strength identifies specific CRE-gene regulatory interactions.
a, Genome browser shot of tb1 and its fine-mapped distal regulatory region. Chromatin loops are represented as lines with dots indicating −log10(p-value). Black and red blocks represent loop edges for all loops interacting with the tb1 locus (indicated as anchor). b, A similar browser shot as in a, but this time showing a genetically mapped eQTL and its predicted target gene. Figures a and b were not performed in replicate. c, The statistical significance of all H3K4me3 HiChIP loops which link dACR-overlapping eQTL to their target genes, versus all other dACR-gene H3K4me3 HiChIP loops. d, The expression of target genes at one edge of the loop and dACR at the other end of the loop, split into the three chromatin groups classified in fig. 2. Shown are loops at high and low −log10(p-value). Boxplots in c and d comprise a median with quartiles, with outliers above the top whiskers. All p-values shown in figures were determined in the FitHiChIP program utilizing a two-tailed binomial test.

