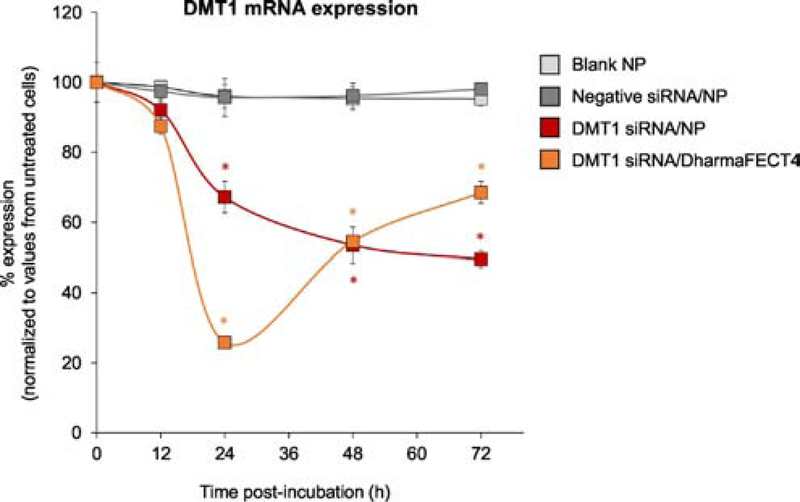
Fig. 3. DMT1 expression in Caco-2 cells exposed to gelatin NPs loaded with DMT1 siRNA.
qPCR was performed for quantification of DMT1 mRNA levels at 12, 24, 48 and 72 h post incubation of NPs. DMT1 mRNA expression in each test group was normalized to untreated cells. Data values are presented as mean ± SE, n=4 individual experiments per group. A mono-exponential kinetic model was employed to fit the gelatin NP-loaded DMT1 data and calculate the half-life. One-way ANOVA was employed, followed by Tukey’s post-hoc analysis. *p<0.05 vs. blank NP at each time point.

