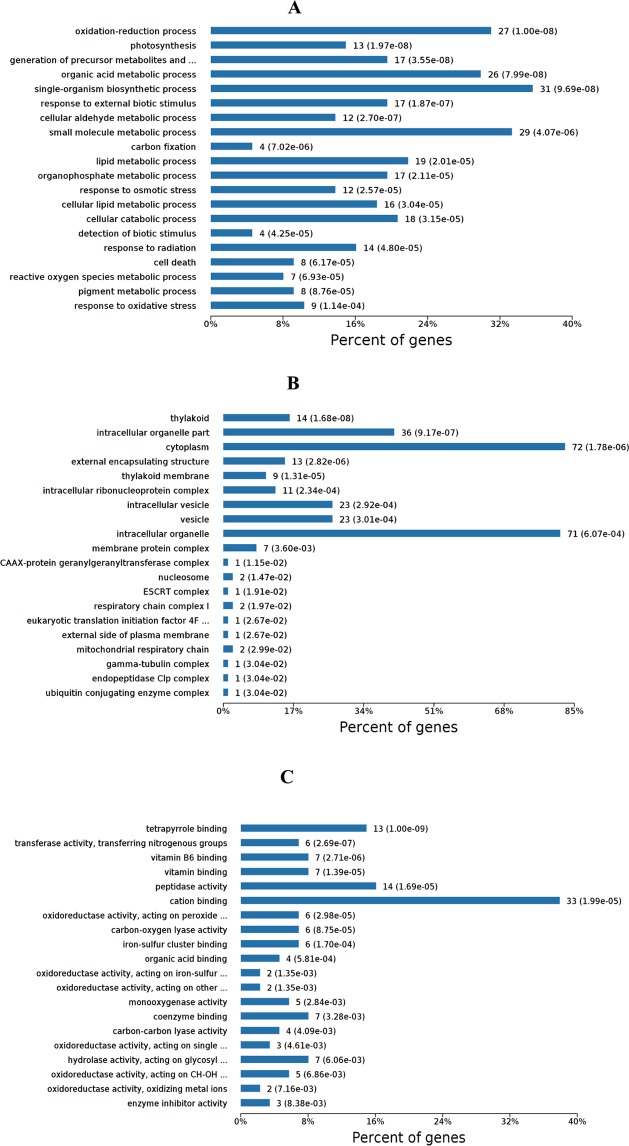
Figure 1.
(A) The results of the biological processes with significant enrichment at Level 4. The horizontal axis represents the number of genes/proteins accumulated in each biological process. The P value is labeled after each bar. (B) The results of significant enrichment of cell components at Level 4. The horizontal axis represents the number of genes/proteins enriched by each cell component. The P value is labeled after each bar. (C) The results of molecular function enrichment at Level 4. The horizontal axis represents the number of genes/proteins enriched by each molecular function. The P value is labeled after each bar.

