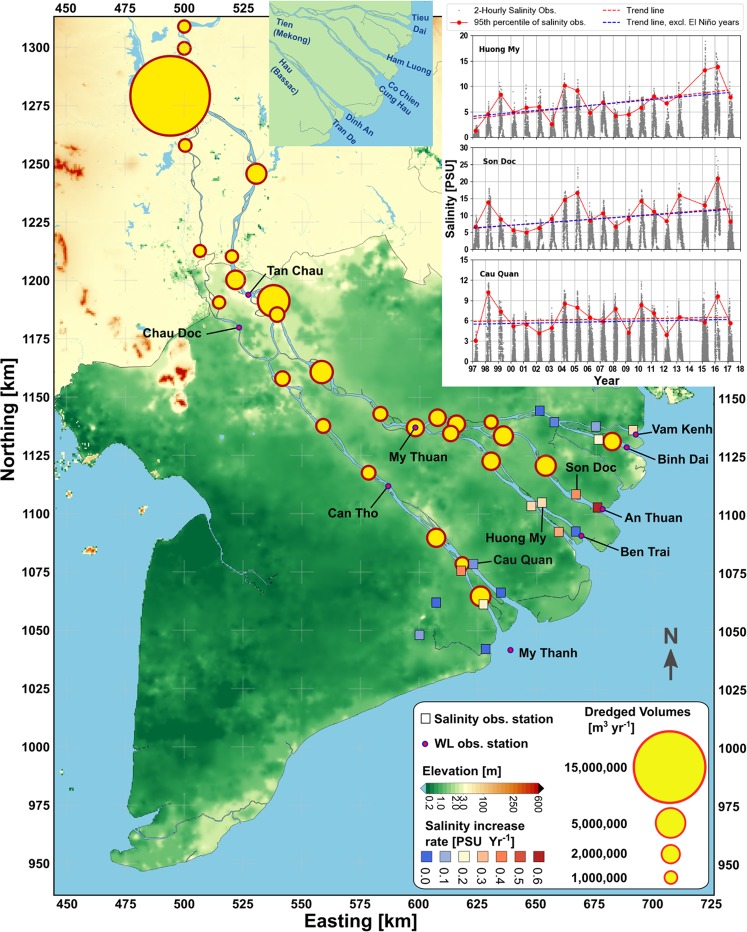
Figure 1.
Digital elevation map of the Mekong Delta30, including the salinity increase rates at multiple stations, the estimated sand mining volumes (scaled with surface area of the circles); The sand mining figures upstream of the VMD are extracted from previous publications10, but updated within the VMD; the top right panel shows three examples of salinity measurement and the P95 trend lines over 20 years; the top panel shows the names of the lower estuarine distributary channels of the Mekong Delta for reference (coord. system WGS84-UTM 48 N).

