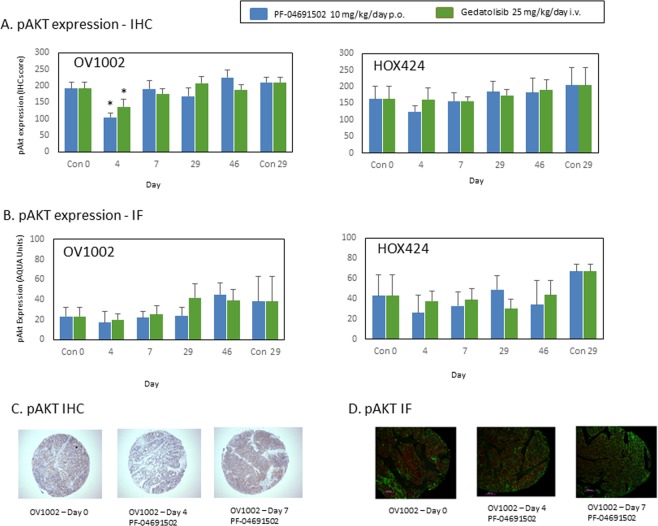
Figure 3.
Expression of pAKT (Ser473) in OV1002 and HOX424 xenografts after treatment with PF-04691502 and gedatolisib. (A) pAKT (Ser473) expression detected by immunohistochemistry. Immunoscores are shown. (B) pAKT (Ser473) expression detected by immunofluorescence. Normalised AQUA scores are shown. (C) Examples of pAKT (Ser473) immunostaining in TMA cores. (D) Examples of pAKT (Ser473) immunofluorescence staining in TMA cores. Mean values shown are average values +/− S.D. for each group of xenografts. *P < 0.05 shown for ANOVA followed by Tukey post-test.

