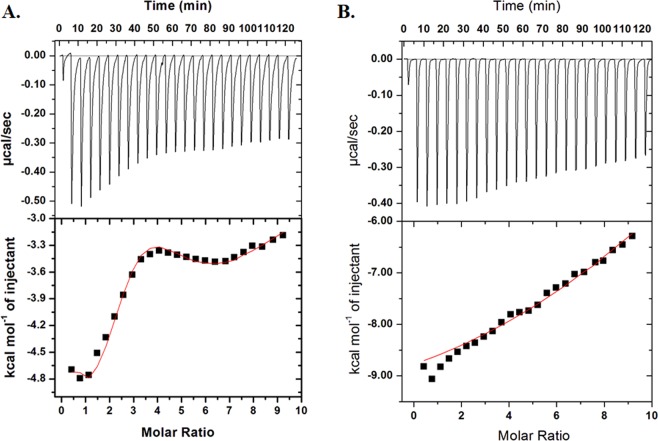
Figure 2.
ITC measurements for the titration of SphK1 with (A) Quercetin and (B) Capsaicin. The upper panel shows the raw data points for heat produced with time with each titration of 750 µM of compound with 15 µM SphK1. The lower panel shows the binding isotherm obtained after integration of peak area and normalization to yield a plot of molar enthalpy change against each compound/SphK1 ratio. The fit curve is shown in red color line.

