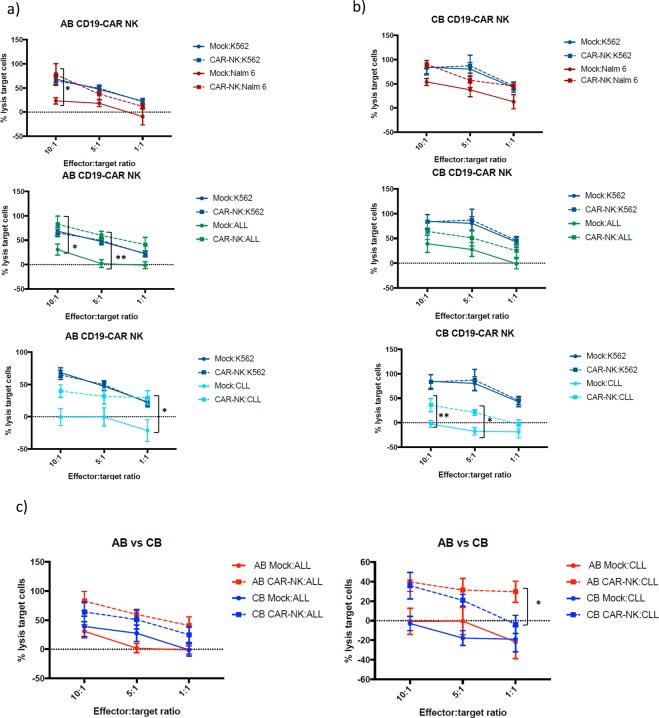
Figure 5.
(a) Percentage of lysis target cells performed by mock (non-transduced) and AB CD19-CAR NK cells against different target cells at different ratios. Graphs were separated in stablished cell lines (Nalm-6, n = 6) and primary cells from patients (ALL n = 4, CLL n = 6), along with K562 as a control. (b) Percentage of lysis target cells performed by mock (non-transduced) and CB CD19-CAR NK cells against different target cells at different ratios. Graphs were separated in established cell lines (Nalm-6 n = 6) and primary cells from patients (ALL n = 4, CLL n = 6), along with K562 as a control. (c) A comparison of the cytotoxicity activity between AB mock and CD19-CAR NK cells, and CB mock (non-transduced) and CD19-CAR NK cells against K562 and CD19 expressing target cells. The symbols represent the mean and error bars represent SEM. Two-Way ANOVA with multiple comparisons was used to analyze the data. p-value: *p < 0.05, **p < 0.005, ***p < 0.001. ****p < 0.0001.

