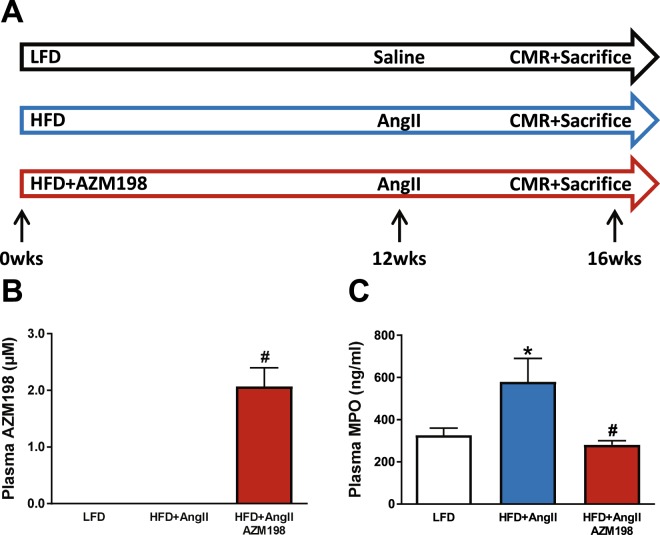
Figure 1.
Experimental design and blood plasma levels of AZM198 and MPO. (A) Schematic experimental overview of the obesity/hypertension mouse model. Three experimental groups were included. Mice received either high fat diet (HFD) or low fat diet (LFD) for 16 weeks. HFD was supplemented with MPO-inhibitor (AZM198) or no inhibitor. During the last 4 weeks, infusion of angiotensin II (AngII) or saline was performed using osmotic minipumps. Prior to sacrifice, cardiac magnetic resonance imaging (CMR), body composition analysis and intraperitoneal glucose tolerance tests (IPGTT) were performed. Mice were sacrificed at 16 weeks. (B) Blood plasma levels of AZM198 at sacrifice. (C) Blood plasma levels of myeloperoxidase (MPO) at sacrifice. N = 11–12. Bars represent means. Error bars represent standard error of the mean. *P < 0.05 as compared to LFD. #P < 0.05 as compared to HFD + AngII.

