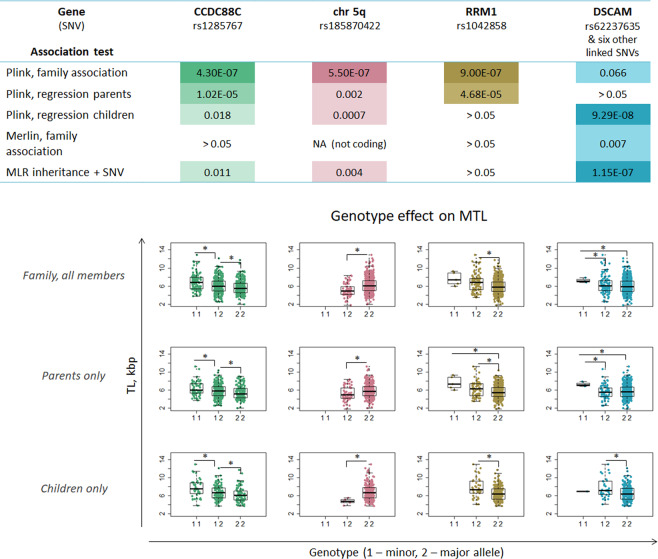
Figure 4.
Significance and genotype effects of MTL-associated SNVs. Colors are used to delineate each SNV. The dark-to-light color gradient indicates low-to-high p values (raw p values from each test). The value of 1 × 10⁻⁷ (E-07) corresponds to FDR threshold of 0.1. Family tests with Merlin only accounted for coding regions, therefore no p-value for the SNV at chr5q was available for this test. The DSCAM gene was identified with six SNVs (rs11701674, rs28412810, rs11700591, rs62237637, rs11702319), which, however, were linked and showed similar patterns represented here with rs11701674 only. Boxplots show MTL values for each individual (in all the samples, or in children or parent only), depending on the amount of minor alleles for each SNV in the genotype. Significant MTL differences between genotypes are highlighted with asterisks. All the SNVs show consistent effect in parents and in children, with the minor allele of SNV at chr5q having negative, while that of the other three SNVs having positive association with MTL.

