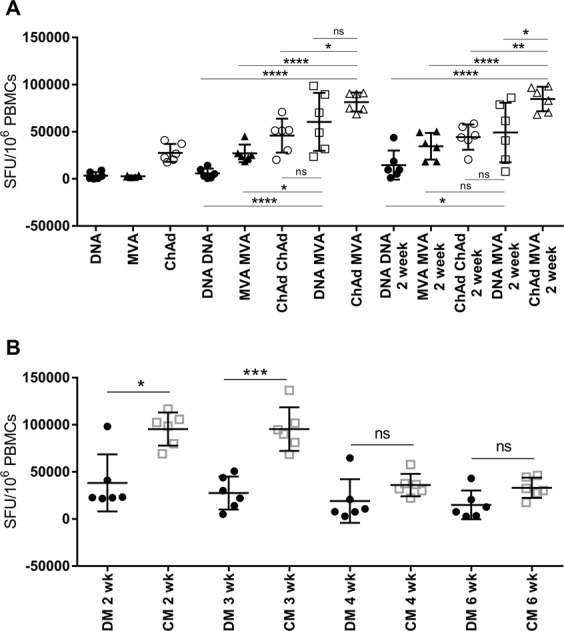
Figure 2.

Induction of T cell responses to 5GHPV3 administered in different vaccination regimens, as measured by IFN-γ Elispot. C57BL/6 mice (6/group) were primed intramuscularly with DNA-5GHPV3 (100 µg), MVA-5GHPV3 (1 × 10⁶ pfu) or ChAdOx1-5GHPV3 (1 × 10⁸ IU) and then boosted intramuscularly with a heterologous or homologous vaccine two weeks later. Tail vein bleeds were performed two weeks post-prime and one and two weeks post-boost. PBMCs were stimulated with peptides spanning the entire immunogen sequence, pooled according to protein source. Data presented is (A) summed responses to all the pools. Further tail vein bleeds were done at three, four and six weeks post-boost immunisation (B). Horizontal lines show mean with standard deviation. One-way ANOVA with Tukey’s multiple comparison testing. *p ≤ 0.05, **p ≤ 0.01, ***p ≤ 0.001, ****p ≤ 0.0001.
