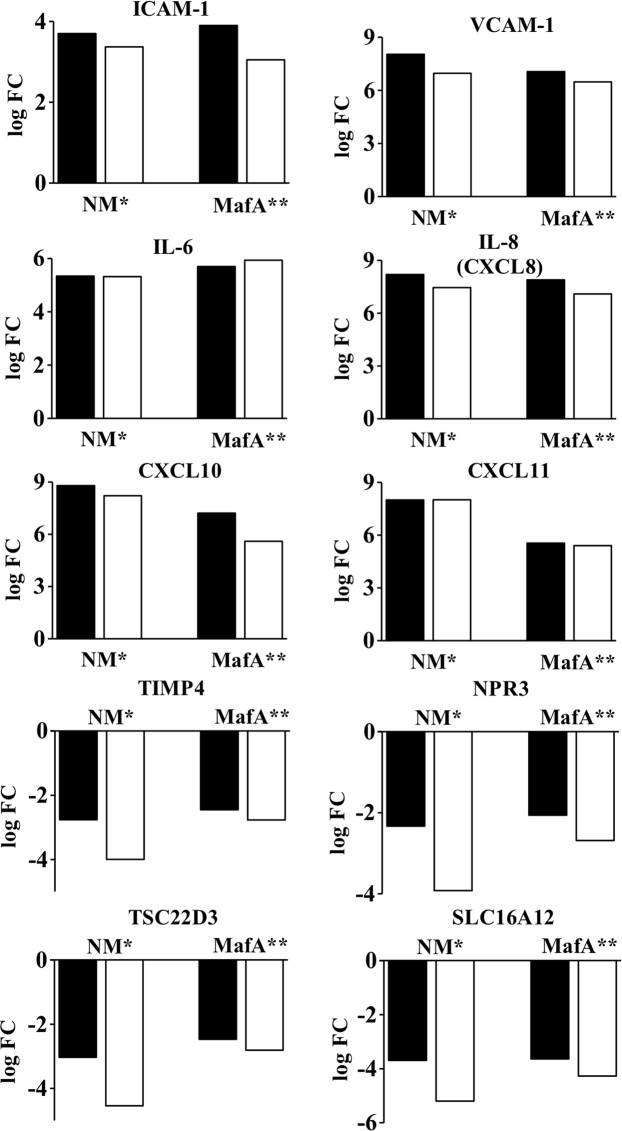
Figure 2.
Validation of DEGs with qRT-PCR. hBMECs induced by Neisseria (NM) or MafA (MafA). Black bars - logFC values from RNA-seq, white bars - logFC calculated from qRT-PCR. *Pearson correlation coefficient (PCC) r = 0.9966; P-value < 0.01; ** PCC r = 0.9959, P-value < 0.01. Please note that, standard deviation (SD) is not shown here as the expression level (log² of ΔΔCT) of DEGs in qRT-PCR was calculated based on average CT values of triplicates (the SD of CT were ranged between 0.005 to 0.28).

