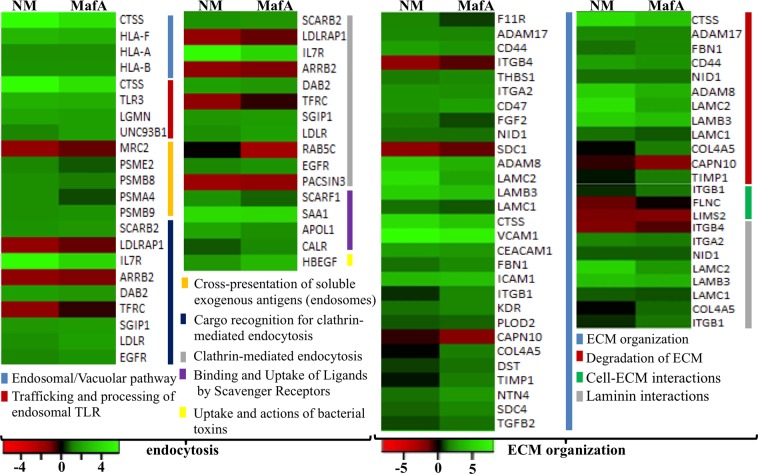
Figure 5.
GO biological processes activated by NM and MafA in hBMECs. Heat maps showing top biological processes related to the endocytosis and ECM (extracellular matrix) organization are presented. Green shaded genes - upregulated, red shaded genes - downregulated. Shading intensity indicates the degree that each gene was upregulated or downregulated. Black color indicates no significant change in the expression. Range of the fold change (logFC values) is presented in the scale.

