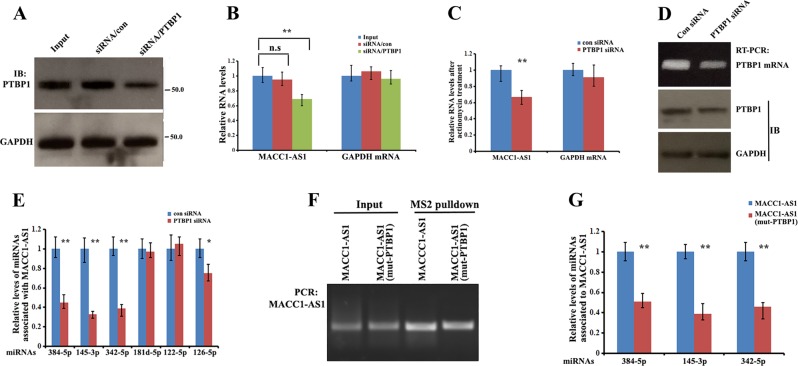
Fig. 6. PTBP1 stabilizes MACC1-AS1 and the binding ability of MACC1-AS1 to miRNAs.
a Western blots showing the expression of PTBP1 in BT549 cells after transfection with PTBP1 siRNA or scrambled siRNA for 48 h. b qRT-PCR indicating the relative levels of MACC1-AS1 in PTBP1 knockdown and control cells. Data are presented as means ± SD from three independent experiments. **P < 0.01 as determined by one-way ANOVA assay. c Levels of MACC1-AS1 in BT549 and BT549/PTBP1-siRNA cells were analyzed after treatment with actinomycin D for 12 h. Relative MACC1-AS1 levels were determined by qRT-PCR. Data are presented as means ± SD from three independent experiments. **P < 0.01 as determined by Student’s t test. d MDA-MB-231/MACC1-AS1-MS2 cells were transfected with PTBP1 siRNA for 48 h. RNA agarose gel electrophoresis and western blots indicated downregulation of PTBP1 mRNA and protein. GAPDH was used as a control. e Cells transfected as in (d) were subjected qRT-PCR to detect the levels of individual miRNAs associated with MACC1-AS1 in pulldown precipitates. **P < 0.01 and *P < 0.05 as determined by Student’s t test. f MDA-MB-231 cells were transfected with constructs expressing MACC1-AS1-MS2 and MACC1-AS1(m)-MS2 for 72 h. RNA agarose gel electrophoresis showed the precipitated MACC1-AS1-MS2 and MACC1-AS1(m)-MS2 in cell extracts. g Cells transfected as in (f) were subjected qRT-PCR, showing that levels of MACC1-AS1-associated miRNAs were greatly reduced when the biding site for PTBP1 was mutated. **P < 0.01 as determined by Student’s t test.

