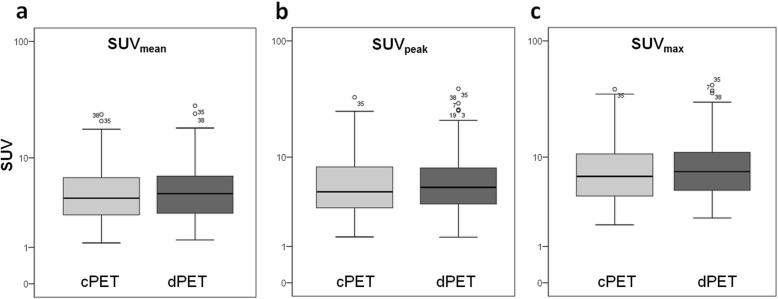
Fig. 1.
SUVmean (a), SUVpeak (b) and SUVmax (c) as measured on cPET and dPET across all lesions (n = 128). The y-axis is shown on a log scale. Average dPET values were significantly higher than cPET values for all three parameters (p < 0.001). This boxplot shows the median, interquartile range and outliers (o): values that are between 1.5 and 3.0 box length from the percentile borders

