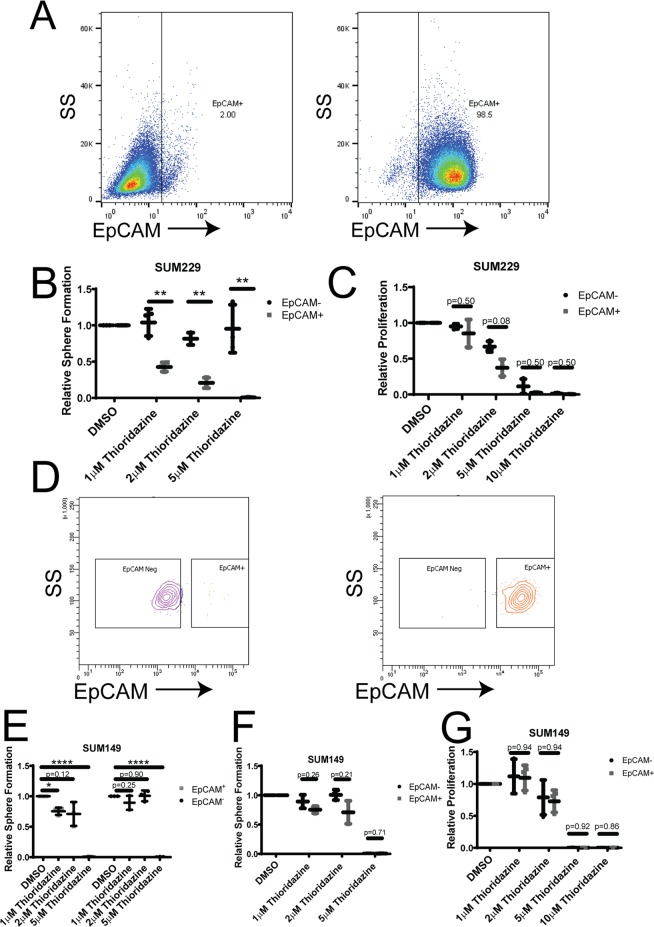
Figure 2.
Tumorsphere formation of the basal-like population within cell lines is more sensitive to thioridazine. (A) The presence of EpCAM on the cell surface of SUM229-EpCAM− cells (left) and SUM229-EpCAM+ cells (right) was assessed using flow cytometry. (B) SUM229-EpCAM− and SUM229-EpCAM+ cells were cultured in a tumorsphere assay. The cells were treated with the indicated concentrations of thioridazine once upon plating. After 7 days, the number tumorspheres formed was assessed. Graph depicts the fold-change in tumorsphere number relative to DMSO control for each cell line. The effect of thioridazine on the tumorsphere formation of EpCAM− cells (black circles) is compared to the effect on EpCAM+ cells (gray squares) (C) SUM229-EpCAM− and SUM229-EpCAM+ cells were cultured adherently. Cells were treated once with the indicated concentration of thioridazine. 72 hours later, the number of cells were counted using a hemocytometer. The graph depicts the fold-change in cell number relative to DMSO control for EpCAM− cells (black circles) compared to EpCAM+ cells (gray squares). (D) SUM149-cells were flow-sorted into EpCAM− and EpCAM+ populations. The post-sort flow analysis shows the surface expression of EpCAM in SUM149-EpCAM− cells (left) and SUM149-EpCAM+ cells (right). (E) SUM149-EpCAM− and SUM149-EpCAM+ cells were cultured in a tumorsphere assay. The cells were treated with the indicated concentrations of thioridazine once upon plating. After 7 days, the number tumorspheres formed was assessed. Graph depicts the fold-change in tumorsphere number relative to DMSO control for each cell line. (F) The graph directly compares the effect of thioridazine on the tumorsphere formation of SUM149-EpCAM− (black circles) and SUM149-EpCAM+ cells (gray squares). (G) SUM149-EpCAM− (black circles) and SUM149-EpCAM+ cells (gray squares) were cultured adherently. Cells were treated once with the indicated concentration of thioridazine. 72 hours later, the number of cells were counted using a hemocytometer. The graph depicts the fold-change in cell number relative to DMSO control, and compares the effect of thioridazine on the proliferation of SUM149-EpCAM− (black circles) and SUM149-EpCAM+ cells (gray squares). All experiments were performed in biological triplicate. Error bars represent standard deviation. Significance in (E) was measured with a one-sided t-test, testing the difference from DMSO control. Significance in (B,C,F,G) was measured with a two-sided t-test. *p < 0.05, **p < 0.01, ***p < 0.001, ****p < 0.0001.

