Figure 3.
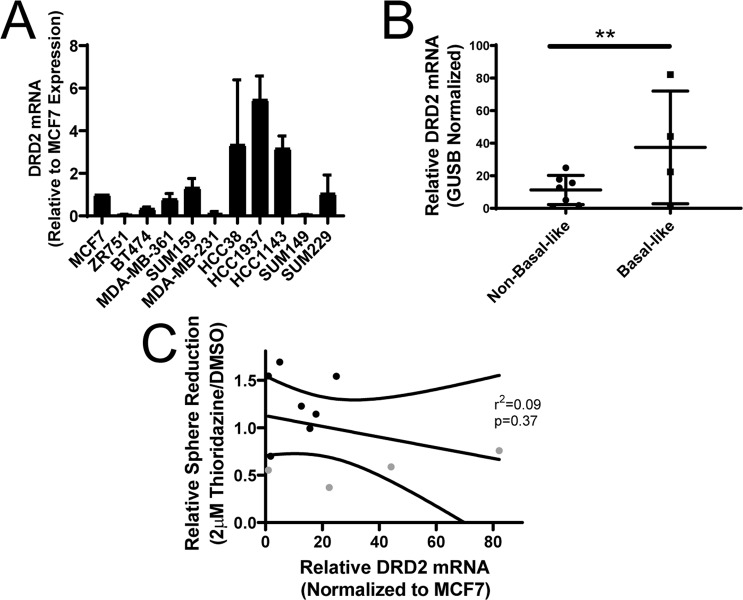
DRD2 mRNA expression in breast cancer cell lines. (A) Total RNA was harvested from a panel of 11 breast cancer cell lines, cDNA was made and DRD2 mRNA abundance was measured by qPCR. Graph depicts the average DRD2 expression normalized to GUSB for each cell line, relative to MCF7 cells. (B) The average expression of each basal-like and non-basal-like cell line is shown. (C) The average DRD2 mRNA expression is shown for each basal-like (gray) and non-basal-like cell line (black) is shown in relation to the effect of 2 µM thioridazine on tumorsphere formation for each cell line. A linear regression was performed to find the line of best fit. Curved lines represent the 95% confidence interval, and the p-value is the likelihood that the slope in non-zero. All experiments were perfomed with biological triplicates. Error bars fpr (B) represent standard deviation. Significance for (B) was measured using a two-sample t-test. **p < 0.01.

