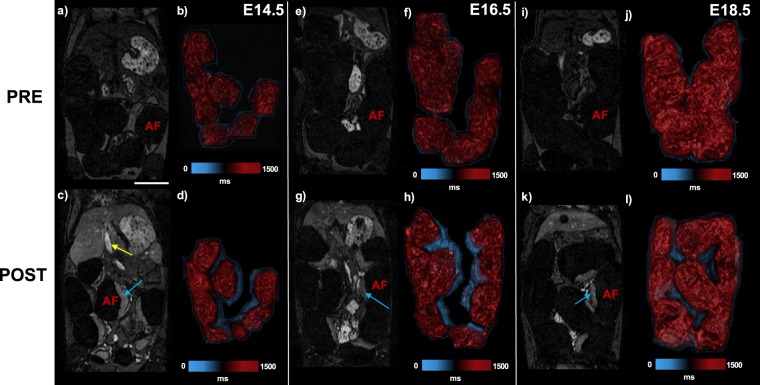
Figure 2.
Nanoparticle contrast-enhanced MRI (CE-MRI) enables T1 mapping of the placenta. Pre-contrast (top row) and post-contrast (bottom row) T1-weighted gradient recalled echo (T1w-GRE) coronal images at E14.5 (a,c), E16.5, (e,g), and E18.5 (i,k) show signal enhancement in the placenta (blue arrow) and IVC (yellow arrow) after administration of liposomal-Gd. No signal is seen in the amniotic fluid (AF) compartment of the feto-placental unit. Volume renderings of corresponding feto-placental units for pre-contrast and post-contrast scans are shown for E14.5 (b,d), E16.5 (f,h), E18.5 (j,l). Color bar indicates T1 relaxation times in milliseconds(ms). Scale bar represents 1 cm.

