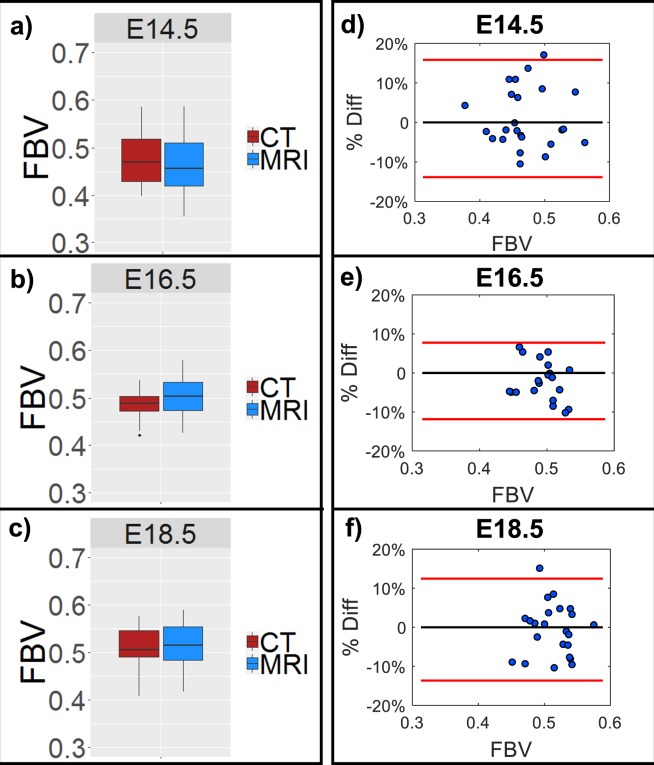
Figure 5.
Placental fractional blood volume (FBV) estimated from nanoparticle contrast-enhanced MRI (CE-MRI) shows close agreement with values estimated by nanoparticle contrast-enhanced computed tomography (CE-CT). Box-and-whisker plots shown for (a) E14.5, (b) E16.5, and (c) E18.5 demonstrate mean placental FBV (horizontal lines) and standard deviation (vertical lines) along with any outliers (·) for CT (red) and MRI (blue). Bland-Altman plots showing the percent difference between MRI and CT estimates of FBV for each individual placenta are also shown for (d) E14.5, (e) E16.5, and (f) E18.5. Percent difference measurements for each individual FPU are represented (blue dots) along with the 95% confidence interval (red lines).

