Figure 2.
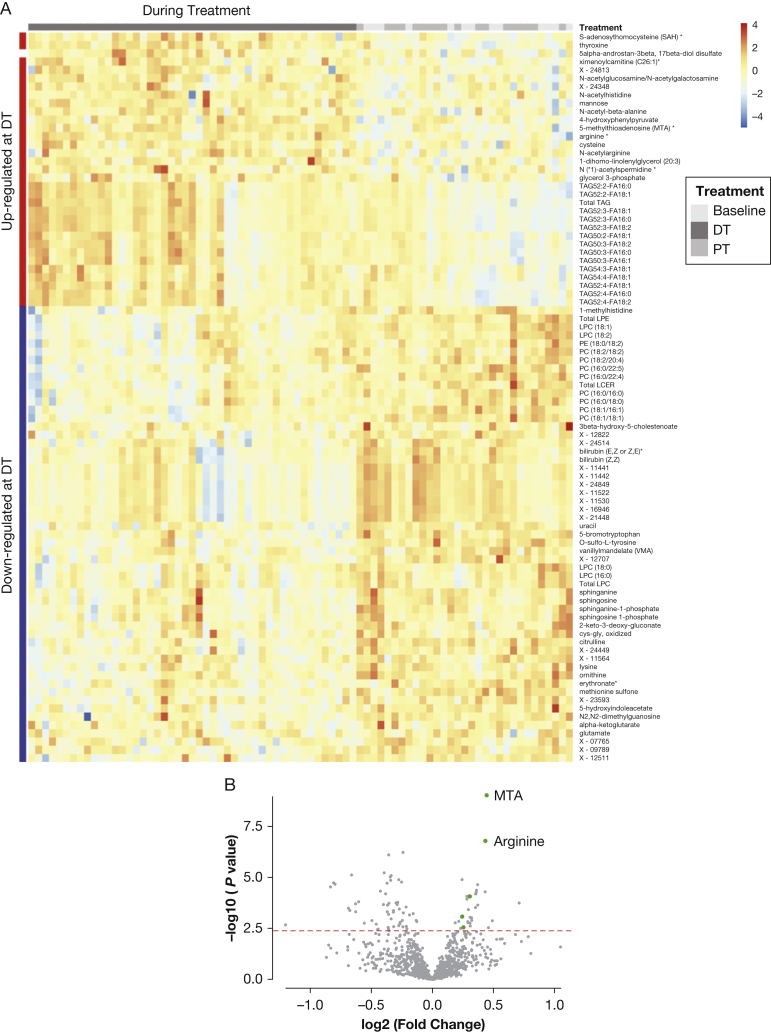
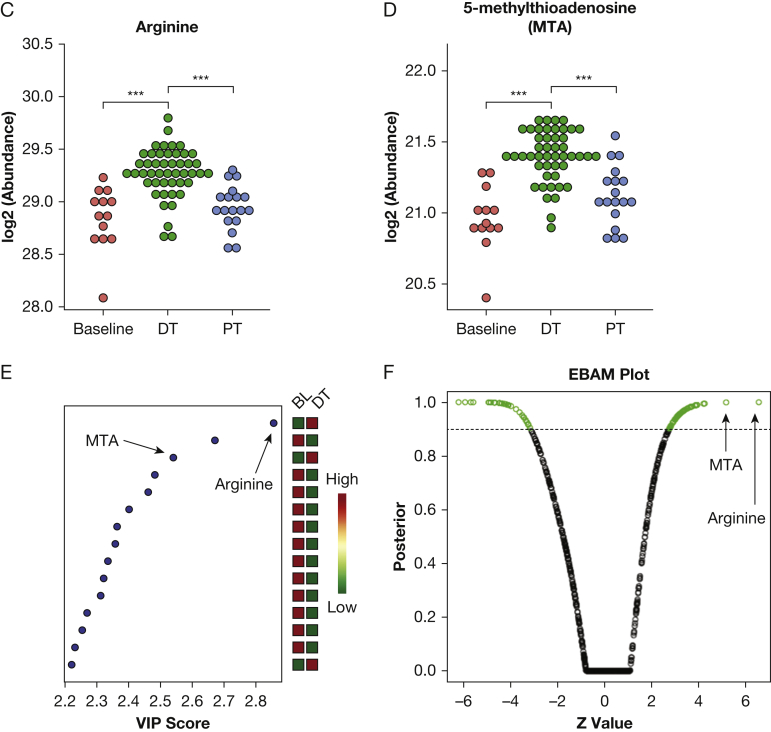
Differential analysis of metabolomic profiles across baseline (BL), during treatment (DT), and posttreatment (PT) identified upregulation of 5′-methylthioadenosine (MTA)-related polyamine metabolism by combinatorial treatment of rapamycin and hydroxychloroquine. A, Heatmap of significantly upregulated and downregulated metabolites (rows) DT and PT (columns). Total triacylglycerol (TAG), specific TAG species, and many metabolites in polyamine metabolism were upregulated DT (indicated as red bar on left side), including MTA, arginine, S-adenosyl-l-homocysteine, and acetylspermidine. B, MTA and arginine in polyamine metabolism showed the most significant upregulation DT compared with baseline. Five of 32 upregulated metabolites are intermediate metabolites in polyamine metabolism (green dots). Dots on the right sides represent upregulated metabolites during treatment, whereas dots on the left side represent downregulated metabolites during treatment. The x axis represents fold change; the y axis represents negative log10-transformed P values. The dashed red line indicates a false discovery rate (FDR) cutoff of 0.05. C, Arginine was significantly upregulated DT compared with BL and PT (***P < .001). The y axis represents normalized log2-transformed values. The DT samples from four visits (n = 47) were grouped for analysis, and PT samples from two visits (n = 18) were grouped for analysis. D, MTA was significantly upregulated DT compared with BL and PT (***P < .001). The y axis represents normalized log2-transformed values. E, MTA and arginine are among the most significant metabolites identified by partial least squares-discriminate analysis. The colored boxes on the right indicate the relative concentrations of the corresponding metabolite in BL and DT samples. The variable importance in projection (VIP) score is a weighted sum of squares of the partial least squares loadings. A full list of significant metabolites with VIP scores is provided in e-Table 4. F, MTA and arginine are the most significant biomarkers discriminating treatment group from BL identified by empirical Bayes analysis. The green circles represent metabolites that exceed the significance threshold (dotted line). MTA and arginine are labeled. All metabolites identified as biomarkers and their FDR values can be found in e-Table 5. EBAM = empirical Bayes analysis of microarrays; FA = fatty acid; LCER = lactosylceramide; LPC = lysophosphosphatidylcholine; LPE = lysophosphosphatidylethanolamine; PC = phosphatidylcholine; PE = phosphatidylethanolamine. See Figure 1 legend for expansion of other abbreviations.


