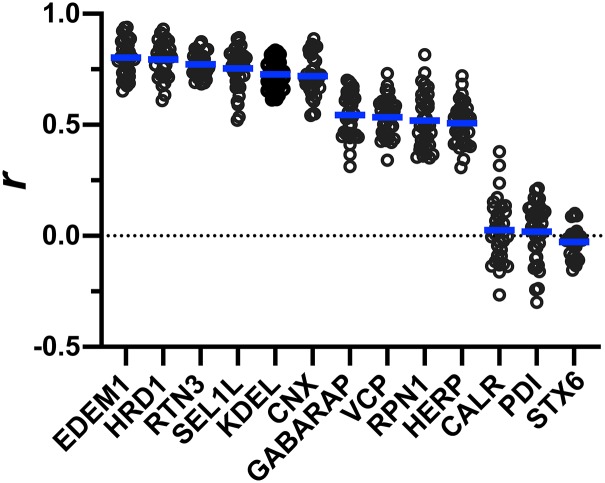
FIG 4.
Quantification of colocalization between UL148 and cellular markers. A Pearson’s correlation coefficient (r) was calculated using NIH ImageJ software to estimate the degree of colocalization between UL148 (HA signal) and each of the indicated cellular markers. A minimum of 30 cells were analyzed per marker. The arithmetic mean for each colocalization analysis result is shown as a blue line, and data points for individual cells analyzed are plotted as circles.

