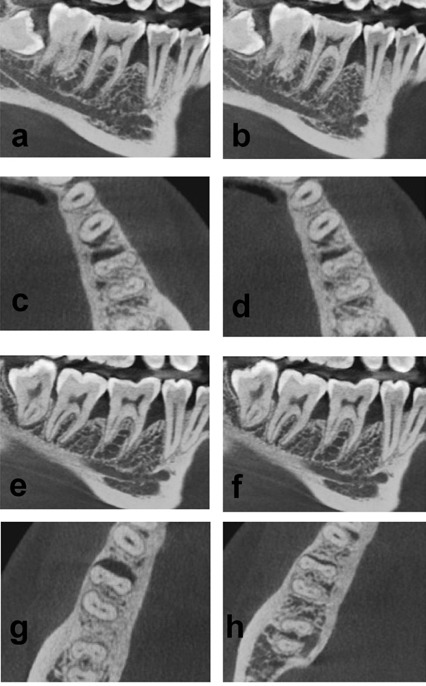
Figure 3.

Comparison of CBCT images at baseline and after 6 months between groups 1 and 2. (a) Intraosseous defect in the sagittal view in group 1 at baseline. (b) Reduction in the intraosseous defect in the sagittal view in group 1 at 6 months. (c) The intraosseous defect in the transverse view in group 1 at baseline. (d) Reduction in the intraosseous defect in the transverse view in group 1 at 6 months. (e) The intraosseous defect in the sagittal view in group 2 at baseline. (f) Reduction in the intraosseous defect in the sagittal view in group 2 at 6 months. (g) The intraosseous defect in the transverse view in group 2 at baseline. (h) Reduction in the intraosseous defect in the transverse view in group 2 at 6 months.
