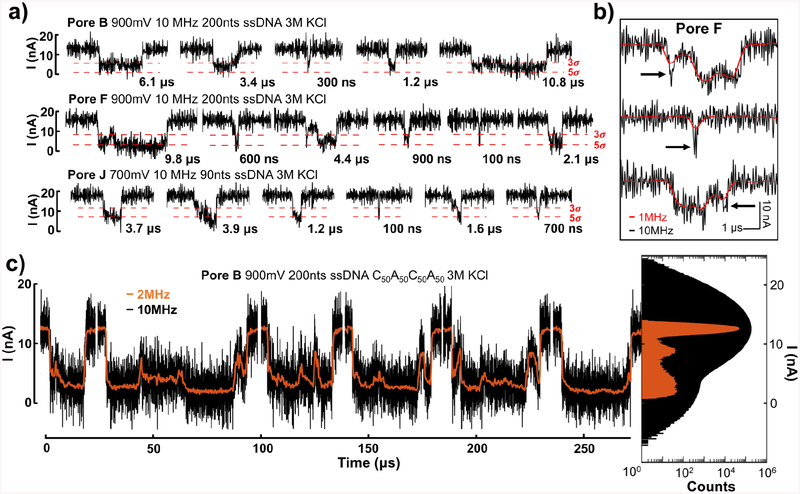
Figure 4.
ssDNA translocation events at 10 MHz measurement bandwidth and comparison with data filtered at 1 MHz and 2 MHz. a) Sample events of unfiltered 10 MHz data containing translocation events of various durations from several pores (Pore B, Pore F and Pore J) and conditions as indicated. The events are as short as 100 ns. Only the events that surpass the 5-sigma thresholds are shown here, and the 3-sigma and 5-sigma threshold lines are marked by the red dashed lines. b) Example events from Pore F demonstrating short events and short features within the events that are missed or greatly attenuated in magnitude, indicated by arrows, at 1 MHz (red), but detectable at 10 MHz (black). c) The concatenated traces of selected events with dwell times over 10 μs from Pore B at bandwidth of 10 MHz (black) and 2 MHz (orange) are shown in the left panel. The right panel is the all-points histograms of a one-second-long current trace with 155 events from which 6 selected events to the left are chosen. The black histogram is for the data taken at 10 MHz and the orange histogram is for the same data set but filtered down to 2 MHz.

