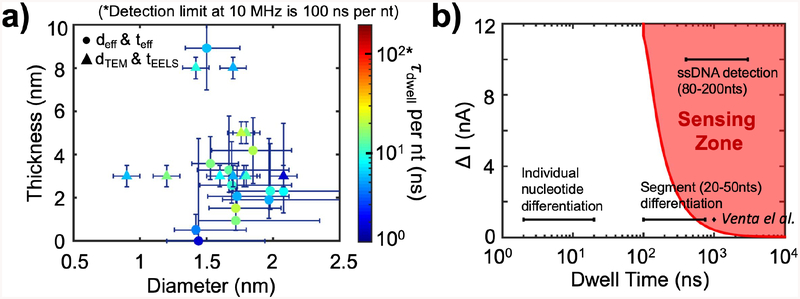
Figure 5.
Characteristic dwell times for all pores vs. pore diameters and thicknesses, and the ssDNA ionic signal, ΔI, vs. dwell time, τdwell, parameter space. a) Characteristic dwell time per nucleotide (τdwell per nt) plotted as a function of the nanopore diameter and thickness for all pores. deff and teff are marked as circles, and dTEM and tEELS are marked as triangles in the graph. The time detection limit of a 10 MHz amplifier is 100 ns per nt, above which our 10 MHz amplifier could accurately report a signal from each nucleotide. The blue vertical and horizontal lines represent errors in thickness and diameter, described in the text. DNA used are 90–200 nts long ssDNA, salt solutions are 1 M or 3 M KCl, and biased voltages are from 400 – 900 mV, as listed in Table 2. b) The red curve is the minimum current blockade (ΔI) for translocation events as a function of dwell time to surpass the 5s threshold, which we define as the minimum requirement for an event to be detected by the 10 MHz amplifier; Hence, the red area represents the 10 MHz 5-sigma “Sensing Zone”. As seen from the red shaded region, for large ΔI, the minimum detection time is 100 ns; as ΔI decreases, the minimum detection time increases to about 500 ns at ΔI = 1 nA. The detection of ssDNA (ΔI = 10 nA, τdwell = 0.4 – 3μs), homopolymer segment (20–50 nts) differentiation (ΔI = 1 nA, τdwell = 0.1 – 0.8 μs), and individual nucleotide differentiation (ΔI = 1 nA, τdwell = 2 – 20 ns) are marked as black horizontal line segments on the graph, and only the right end of the “segment (20–50 nts) differentiation” line overlaps with the “sensing zone”. The ΔI from Venta et al.7 for 30-nucleotides-long ssDNA homopolymers with similar pores is marked as the diamond on the graph for reference.

