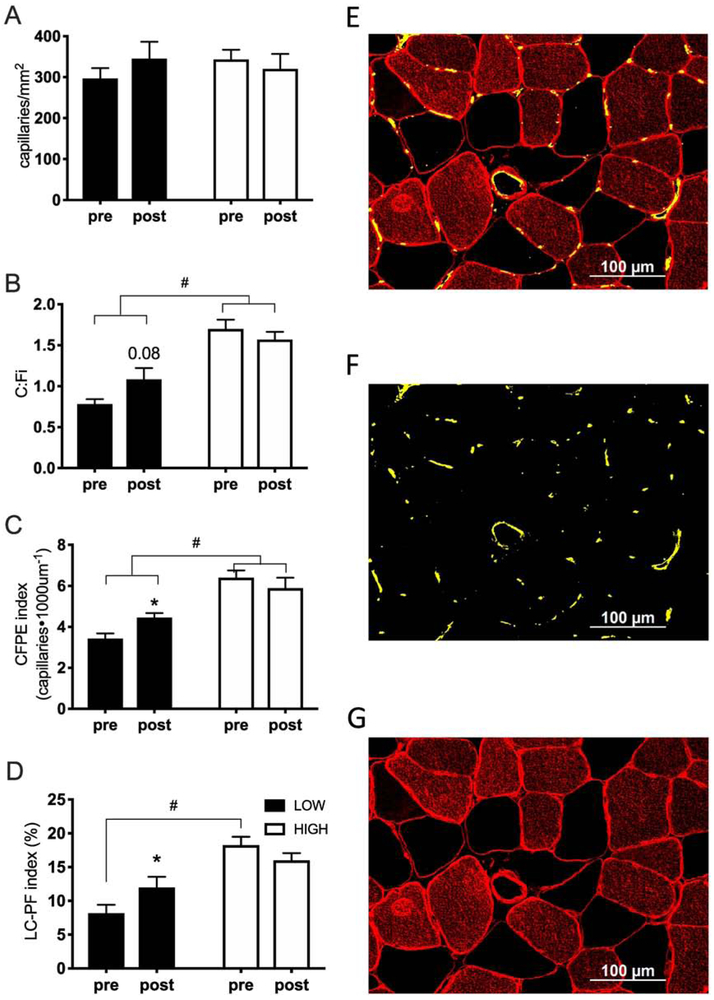
Figure 2.
Muscle fiber capillarization indices before and after 12 weeks of RET. Muscle fiber capillarization indices before and after 12 weeks of RET (A-D) and representative immunohistochemical image demonstrating merged imaged (E), capillaries only (F) and Laminin and MyHC type I only (G). Data on fiber-type specific capillarization can be found in Table 2. (HIGH, relative high baseline CFPE index; N=9; LOW, relative low baseline CFPE index; N=10). RET, resistance exercise training; CFPE, capillary-to-fiber perimeter exchange; LC-PF capillary-to-fiber interface. Data represent mean±SE.
* significantly different from pre-RET (p<0.05).
+ main effect of condition (HIGH/LOW group) (p<0.05).

