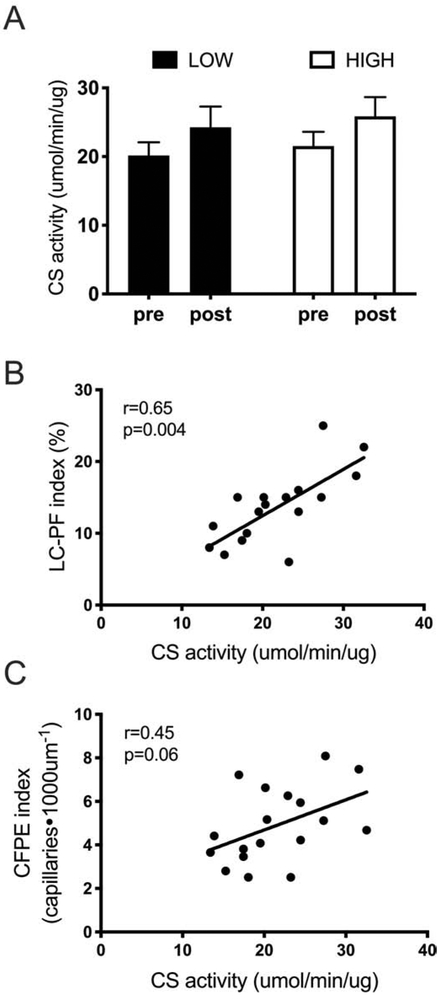
Figure 3.
Relationship between microvascular supply and oxidative capacity. A) Citrate synthase activity after 12 weeks of training in relative LOW (N=9) and relative HIGH (N=10) group. B) Correlation between LC-PF index and citrate synthase activity. C) Correlation between CFPE index and citrate synthase activity. CS, citrate synthase; LC-PF capillary-to-fiber interfaced; RET, resistance exercise training; HIGH, relative high baseline CFPE index. Data represent mean±SE.

