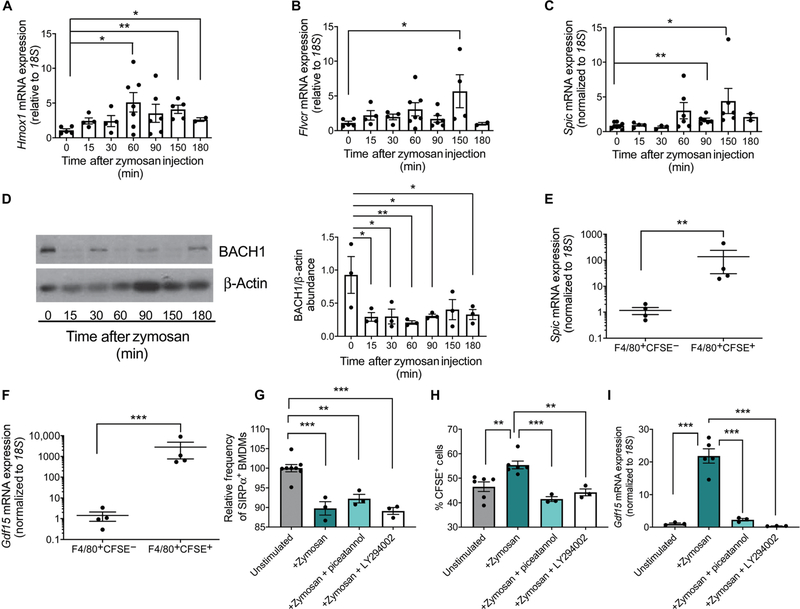
Fig. 4. Increased intracellular heme due to erythrophagocytosis drives changes in heme-dependent gene expression.
(A to C) RNA was isolated from splenocytes at the indicated times after zymosan treatment. The expression of Hmox1 (A), Flvcr (B), and Spic (C) was measured relative to 18S. Data represent the mean ± SEM, one-way ANOVA with Dunnett’s multiple comparison test. n = 4 to 7 mice per time point (Hmox1 and Flvcr); n = 3 to 8 mice per time point (Spic). (D) Representative Western blot and quantification of BACH1 abundance in the spleen at the indicated time points after zymosan treatment. β-Actin is included as a loading control and was used for calculating the relative abundance of BACH1 using ImageJ software. Data represent the mean ± SEM, one-way ANOVA with Dunnett’s multiple comparison test, n = 3 mice per time point. (E and F) Splenocytes from mice transfused with CFSE-labeled erythrocytes were sorted into F4/80+CFSE− and F4/80+CFSE+ populations 3 hours after zymosan treatment. Expression of Spic and Gdf15 was measured relative to 18S in RNA isolated from each population. Data represent the mean ± SEM. Student’s t tests were performed on log scale–transformed data. n = 4 mice per group. (G) Quantification of the abundance of SIRPα on the surface of bone marrow–derived macrophages (BMDMs) relative to that on unstimulated BMDMs as measured by flow cytometry 1 hour after zymosan treatment with or without the Syk inhibitor piceatannol or the PI3K inhibitor LY294002. All replicates were normalized to 0 min (baseline). Data represent the mean ± SEM. Data were analyzed by one-way ANOVA with Tukey’s multiple comparison test, n = 3 to 6 independent biological replicates. (H) F4/80+CFSE+ populations, representing phagocytosis of CFSE-labeled erythrocytes, were measured by flow cytometry 1 hour after the indicated treatments. Data represent the mean ± SEM. Data were analyzed by one-way ANOVA with Tukey’s multiple comparison test, n = 3 to 6 independent biological replicates. (I) Quantification of Gdf15 expression relative to 18S in BMDMs 3 hours after the indicated treatments. Data represent the mean ± SEM. Data were analyzed by one-way ANOVA with Tukey’s multiple comparison test, n = 3 to 6 independent biological replicates. *P < 0.05, **P < 0.01, and ***P < 0.005.

