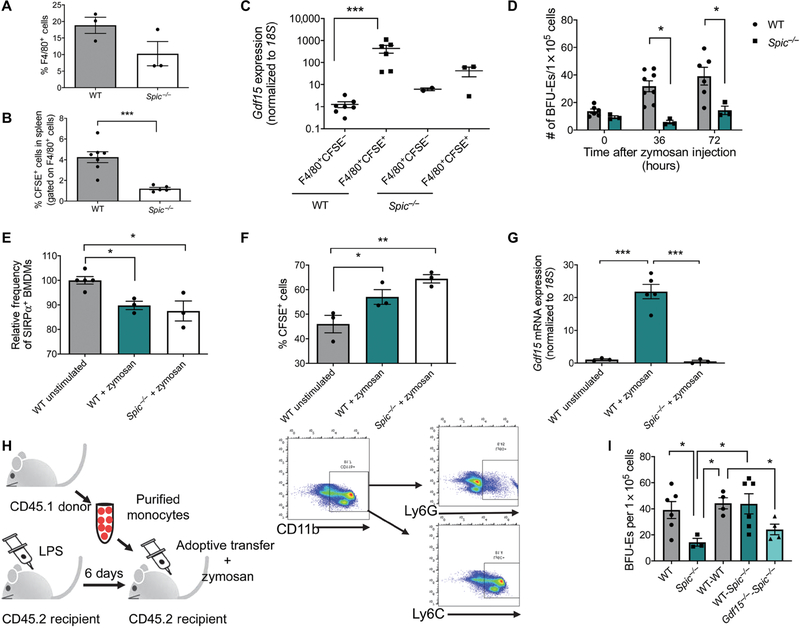
Fig. 6. SPI-C is critical for the induction of Gdf15 and is required for the activation of stress erythropoiesis in response to inflammation.
(A) Percentage of F4/80+ cells in the spleen as determined by flow cytometry. Data represent the mean ± SEM. Student’s t test, n = 3 mice per genotype. (B) WT and Spic−/− mice were treated with LPS, transfused with CFSE-labeled erythrocytes, and treated with zymosan for 3 hours. The frequency of F4/80+CFSE+ cells in the spleen was determined by flow cytometry. Data represent the mean ± SEM. Student’s t test, n = 4 to 7 mice per genotype. (C) Quantification of Gdf15 relative to 18S in F4/80+CFSE− and F4/80+CFSE+ cells sorted from the spleen of Spic−/− or control mice. Data represent the mean ± SEM, one-way ANOVA with Tukey’s multiple comparison test performed on log scale–transformed data, n = 3 to 7 mice per population for each genotype. (D) Splenocytes isolated from Spic−/− or control mice were isolated at the indicated times after zymosan treatment and cultured under conditions that induce stress erythropoiesis. Stress BFU-Es were scored by staining with benzidine. Data represent the mean ± SEM. Student’s t test, n = 3 to 5 mice per genotype. (E) Relative frequencies of SIRPα+ BMDMs after zymosan stimulation from Spic−/− and WT mice as measured by flow cytometry and normalized to WT unstimulated control. Data represent the mean ± SEM, one-way ANOVA with Tukey’s multiple comparison test, n = 3 to 5 independent biological replicates. (F) Percentage of CFSE+ cells as measured by flow cytometry in zymosan-stimulated BMDMs 1 hour after the addition of CFSE-labeled erythrocytes. Data represent the mean ± SEM, one-way ANOVA with Dunnett’s multiple comparison test, n = 3 independent biological replicates. (G) Quantification of Gdf15 expression relative to 18S in zymosan-stimulated BMDMs 3 hours after the addition of CFSE-labeled erythrocytes. Data represent the mean ± SEM, one-way ANOVA with Tukey’s multiple comparison test, n = 3 to 5 independent biological replicates. (H) Schematic depicting experimental design of adoptive transfer of purified monocytes and representative flow cytometry plots demonstrating enrichment of the CD11b+Ly6G−Ly6C+ monocyte population after magnetic bead selection. (I) Analysis of stress BFU-Es in the spleen after monocyte transfer at the indicated times after zymosan treatment. WT (WT mice receiving no monocytes); Spic−/− (Spic−/− mice receiving no monocytes); WT-WT (WT monocytes into WT mice); WT-Spic−/− (WT monocytes into Spic−/− mice); Gdf15−/−-Spic−/− (Gdf15−/− monocytes into Spic−/− mice). Data represent the mean ± SEM, one-way ANOVA with Tukey’s multiple comparison test, n = 3 to 6 mice per group. *P < 0.05, **P < 0.01, and ***P < 0.005.

