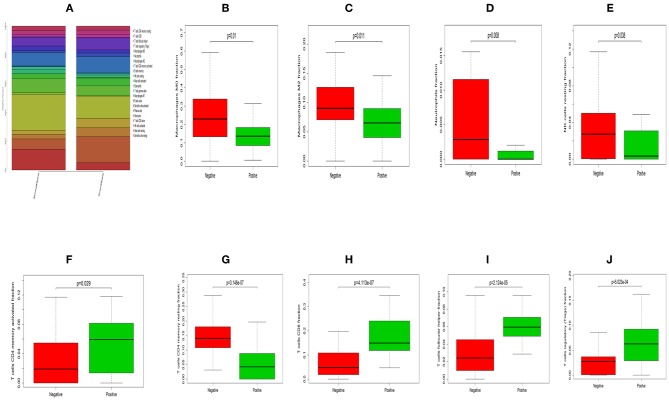
Figure 5.
The difference between immune infiltration between HNC HPV positive and negative samples. (A) The total difference in immune cells infiltration. Box plot of the distribution of CIBERSORT P value for Macrophages M0 (B), Macrophages M2 (C), Neutrophils (D), NK cells resting (E), T cells CD4 memory activated (F), T cells CD4 memory resting (G), T cells CD8 (H), T cells follicular helper (I) and T cells regulatory (Tregs) (J), respectively.

