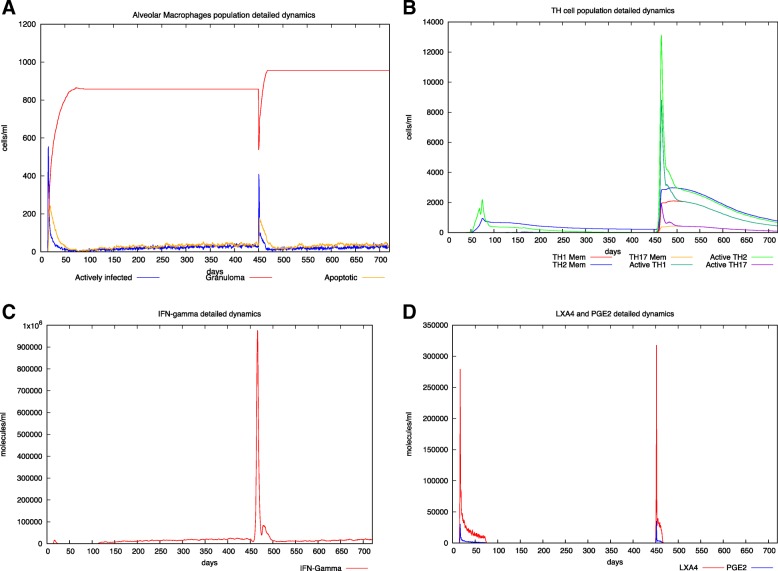
Fig. 3.
In silico latent tuberculosis infection with reactivation event scenario. Panel A depicts AM population dynamics. In particular, it is simulated the time course of the MTB-alveolar macrophages infected levels, the apoptotic ones and those forming granuloma. One can appreciate the breakdown of the granuloma leading to a successive reactivation at day 450. Moreover, granuloma increases in dimension indicating a worsening of the disease. Panel B shows Helper T cells dynamics. Subtypes (TH-1, TH-2 and TH-17) are reported. At the reactivation time, it is reported an evident TH-2 switch. However also a TH-1 driven response is present. Panel C describes IFN-γ dynamics. The peak of IFN- γ indicates an attempt of immune system to contain the MTB spreading. In panel D LXA4 and PGE2 detailed dynamics are reported. The simulator correctly predicts a predominant second peak of LXA4 indicating a pro-necrotic induction commonly observed in virulent strain of MTB. For all the simulated scenarios, time has been set to 720 days (2 years) and the virtual patient has been challenged with MTB at day 40

