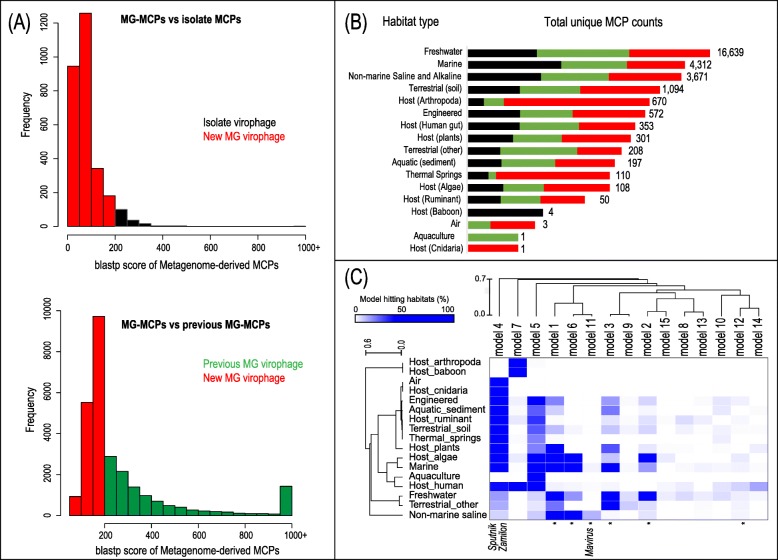
Fig. 2.
Diversity and habitat distribution of MCP sequences. a MCP sequence diversity of the 28,294 non-redundant sequences (de-replicated at 95% identity over 95% of the shortest length; see the “Methods” section) represented by a blastp score histogram against isolate virophage MCPs (upper) or previously reported metagenome-derived MCPs (bottom). The more dissimilar MCP sequences (score < 200) are shown in red while those related to MCPs from isolated virophages (Sputnik, Mavirus, and Zamilon) or previously published MCP sequence are shown in black and green, respectively. b Habitat type distribution of the non-redundant MCP dataset. Total number of MCP counts by habitat type in logarithmic scale. Colors represent the proportion (non-logarithmic) of non-redundant MCP sequences from the groups in panel a; code: MCP counts from similar to an isolated virophage in black; MCP counts from similar to a previously published virophage in green; MCP counts from more dissimilar detected sequences in red. c Link between MCP models and the habitat types where their associated sequences were found. The heat map indicates the percentage of hits to each MCP model per habitat type. MCP models containing sequences from isolated virophages or reference metagenomes are indicated at the bottom with the name of the isolate or with an asterisk, respectively. Hierarchical clustering (complete linkage) of both models and habitats was applied after a quantile normalization. Although unlikely, some MCP sequences identified on short contigs with uncertain origin may derive from virophage MCPs integrated in their host genomes

